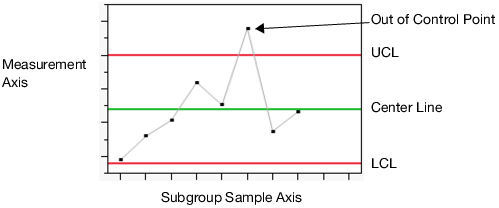
The analysis produces a chart that can be used to determine whether a process is in a state of statistical control. The report varies depending on the type of chart that you select. Figure 4.8 displays the parts of a simple control chart. Control charts update dynamically as data is added or changed in the data table.
Figure 4.8 Example of a Control Chart
|
•
|
Each point plotted on the chart represents an individual process measurement or summary statistic. In Figure 4.8, the points represent the average for a sample of measurements.
|
Subgroups should be chosen rationally, that is, they should be chosen to maximize the probability of seeing a true process change between subgroups.
|
•
|
The two red lines are the upper and lower control limits, labeled UCL and LCL. These limits give the range of variation to be expected in the summary statistic when the process is in statistical control. If the process is exhibiting only routine variation, then all the points should fall randomly in that range. In Figure 4.8, one measurement is above the upper control limit. This is evidence that the measurement could have been influenced by a special cause, or is possibly a defect.
|
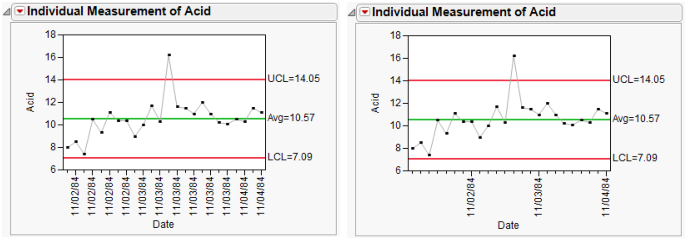
When you double-click the x or y axis, the appropriate Axis Specification window appears for you to specify the format, axis values, number of ticks, gridline, reference lines, and other options to display on the axis.
For example, the Pickles.jmp data lists measurements taken each day for three days. In Figure 4.9, by default, the x axis is labeled at every other tick. Sometimes this gives redundant labels, as shown to the left in Figure 4.9. If you specify a label at an increment of eight, the x axis is labeled once for each day, as shown in the chart on the right.
Figure 4.9 Example of Labeled x Axis Tick Marks
Tip: For information about warnings and rules, see Tests and Westgard Rules in Control Chart Builder of this guide.