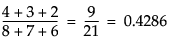
For the first chart in Figure 10.5 that plots all X, Grouping variables on the x-axis, the percent Agreement is calculated as follows:
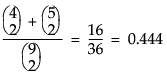
For the second chart in Figure 10.5 that plots all Y, Response variables on the x-axis, the percent Agreement is calculated as follows:
|
•
|
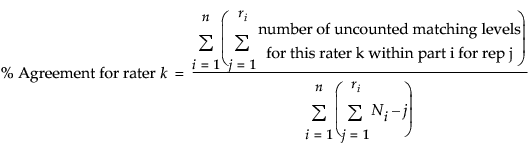
n = number of parts (grouping variables)
|
|
•
|
|
•
|
m = number of raters
|
|
•
|
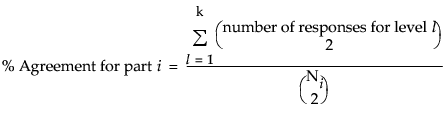
k = number of levels
|
|
•
|
Ni = m x ri. Number of ratings on part i (i = 1,...,n). This includes responses for all raters, and repeat ratings on a part. For example, if part i is measured 3 times by each of 3 raters, then Ni is 3 x 3 = 9.
|
 and
and