This example uses the Failuressize.jmp sample data table, which contains failure data and a frequency column. It lists causes of failure during the fabrication of integrated circuits and the number of times each type of defect occurred for two processes. Among the other causes (Oxide Defect, Silicon Defect, and so on) is a cause labeled size. Specifying size as the cause code designates the rows as size rows.
|
1.
|
|
2.
|
|
3.
|
|
4.
|
|
5.
|
|
6.
|
|
7.
|
|
8.
|
Click OK.
|
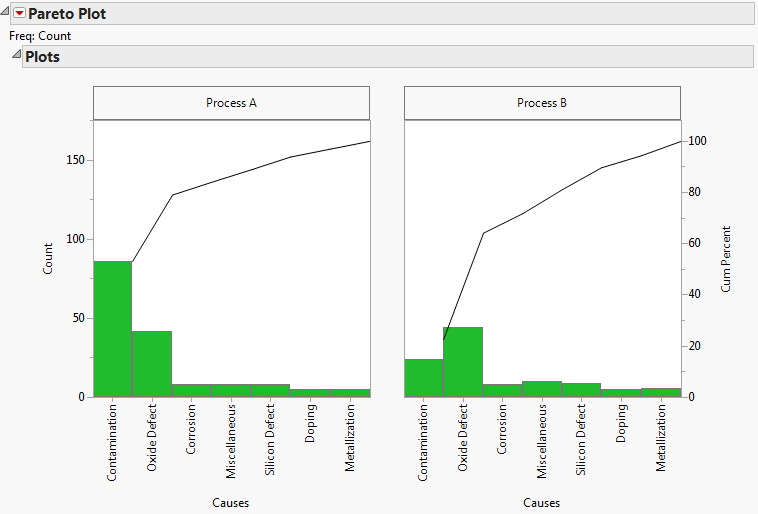
Figure 12.12 Pareto Plot Report Window
|
9.
|
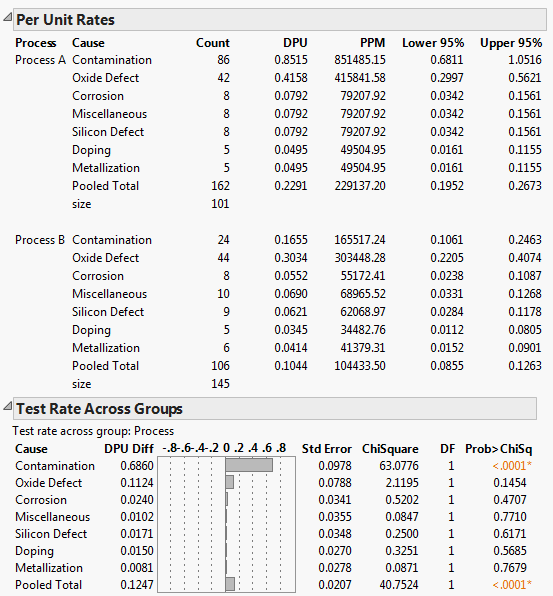
Select Count Analysis > Per Unit Rates and Count Analysis > Test Rates Across Groups from the red triangle menu.
|
Figure 12.13 Per Unit Rates and Test Rates across Groups Results