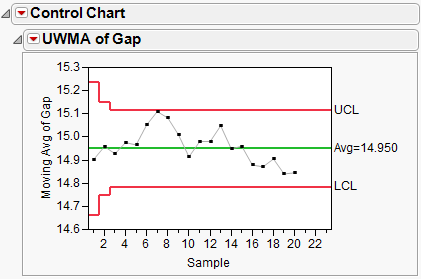
In the sample data table Clips1.jmp, the measure of interest is the gap between the ends of manufactured metal clips. To monitor the process for a change in the average gap, subgroup samples of five clips are selected daily. A UWMA chart with a moving average span of three is examined.
|
1.
|
|
1.
|
Select Analyze > Quality and Process > Control Chart > UWMA.
|
|
2.
|
|
3.
|
|
4.
|
Change the Moving Average Span to 3.
|
|
5.
|
Click OK.
|
The result is the chart in Figure 4.25. The point for the first day is the mean of the five subgroup sample values for that day. The plotted point for the second day is the average of subgroup sample means for the first and second days. The points for the remaining days are the average of subsample means for each day and the two previous days.
Figure 4.25 UWMA Charts for the Clips1 data