This example uses the SAT.jmp sample data table, which contains SAT test scores (divided into verbal and mathematics portions) for all 50 United States.
|
1.
|
|
2.
|
Select Graph > Cell Plot.
|
|
3.
|
|
4.
|
|
5.
|
|
6.
|
Click OK.
|
|
7.
|
Figure 9.6 Cell Plot for SAT Scores
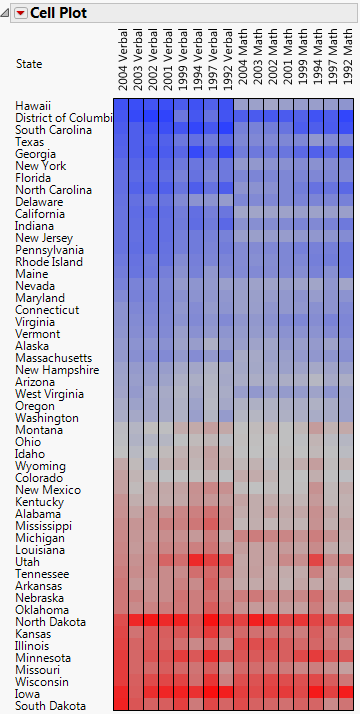
From Figure 9.6, you notice the following: