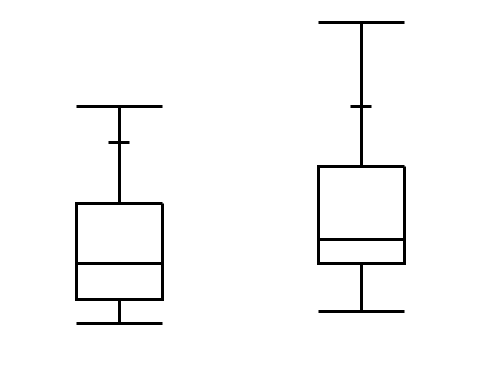
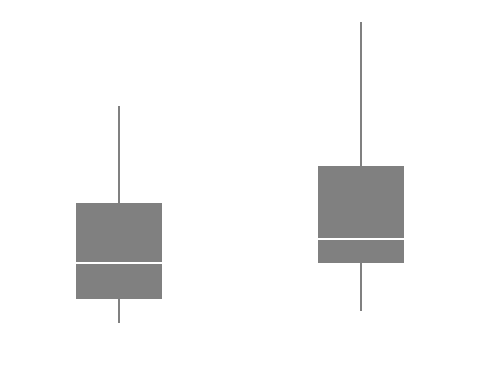
The Box Plot element  shows outlier or quantile box plots. A box plot provides a compact view of a distribution of values. The box plot element is useful when variables have a Numeric data type. For details about outlier and quantile box plots, see Outlier Box Plot and Quantile Box Plot in the Basic Analysis book.
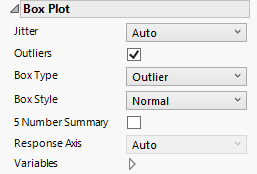
Figure 2.33 Box Plot Options
Tip: If you have multiple graphs, you can color or size each graph by different variables. Drag a second variable to the Color or Size zone, and drop it in a corner. In the Variables option, select the specific color or size variable to apply to each graph.
 |
|
 |
|
 |