The Area element  shows a contiguous area that represents the area beneath summary statistic values of a variable across the values or categories of another variable. The Area element can be considered a continuous representation of the Bar element.
For an example of a graph that uses the Area element, see Examples of Area Plots in Graph Builder Examples.
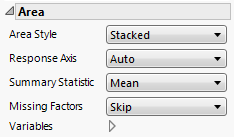
Figure 2.32 Area Options
Changes how the area is displayed when there are merged variables on the response axis. For area style descriptions, see Table 2.2.
Tip: If you have multiple graphs, you can color or size each graph by different variables. Drag a second variable to the Color or Size zone, and drop it in a corner. In the Variables option, select the specific color or size variable to apply to each graph.


