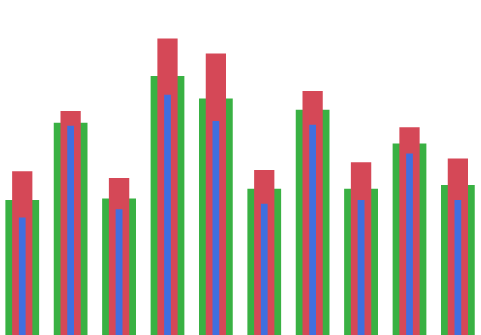
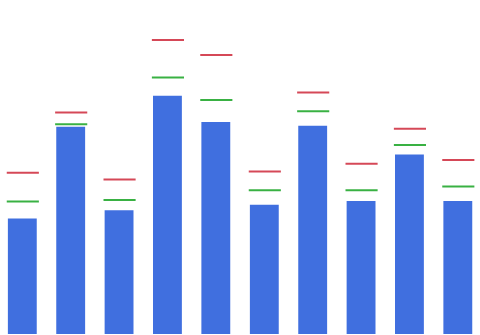
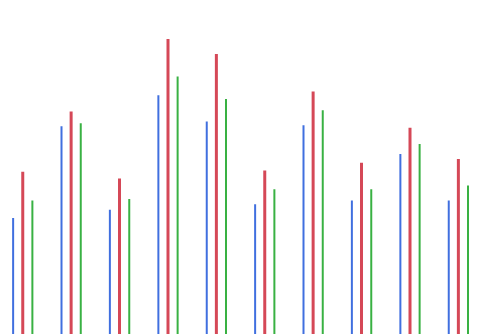
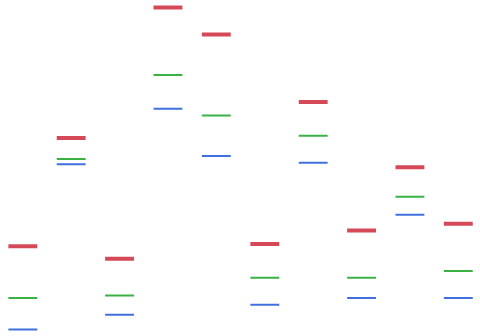
The Bar element  shows a bar chart of summary statistic values of one or more variables across the values or categories of one or more stratifying variables. The graph can display a single variable or multiple variables of any type arranged in the X and Y zones.
For an example of a graph that uses the bar element, see Example of a Stacked Bar Chart in Graph Builder Examples.
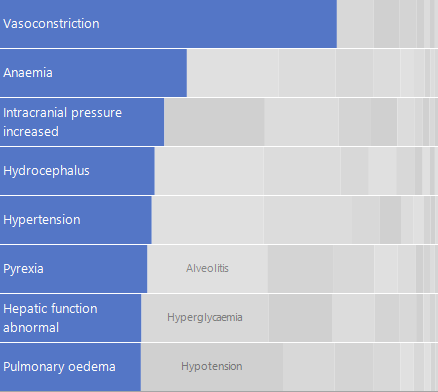
Figure 2.31 Bar Options
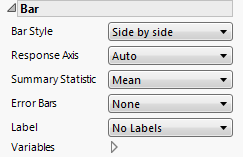
You can change the appearance of the bars that describe the levels of the stratifying variable. Many bar styles are applicable only when there are merged variables on the response axis, or if an overlay variable is present. For bar style descriptions, see Table 2.1. To change bar widths and space, right-click in the graph and select Customize > Bar.
First Stack—Start on the top row and fill it before moving to the next row.
Smallest Stack—Place each bar at the stack that is currently the smallest.
Separate Stack—Make a stack called Other where all secondary bars appear.
Bar color—Applies the same color as the primary bar color.
Faded bar color—Applies a faded version of the primary bar color.
Grays—Applies random shades of light gray.
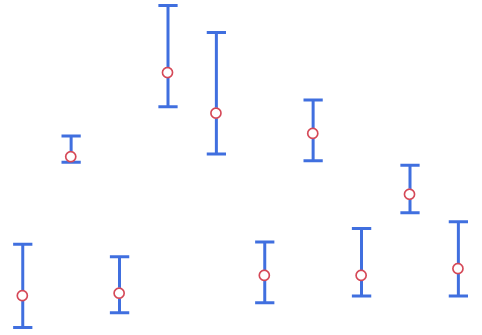
Adds or removes error bars in the graph. To customize error bars, right-click in the graph and select Customize > Error Bar.
Tip: If you have multiple graphs, you can color or size each graph by different variables. Drag a second variable to the Color or Size zone, and drop it in a corner. In the Variables option, select the specific color or size variable to apply to each graph.
 |
|
 |
|
 |
|
 |
|
 |
|
 |
|
 |
|
 |
|
 |
|
 |
|
 |
|
 |
|
 |
|
 |