From a report, to save specification limits to the data table as a column property, select Save > Spec Limits from the red triangle menu next to the name of the analysis variable. When you repeat the capability analysis, the saved specification limits are automatically retrieved.
To save the specification limits and distribution for a capability analysis based on a fitted distribution, select Save Spec Limits from the red triangle menu for the fitted distribution. This option saves a column property for the specification limits and a second one for the distribution that was fit.
Tip: To add specification limits to several columns at once, see Manage Spec Limits Utility in the Quality and Process Methods book.
|
•
|
If a column does not contain specification limits, create the Capability Analysis report by selecting Capability Analysis from the red triangle menu and setting the specification limits.
|
|
•
|
If you fit a distribution to your data (using the Continuous or Discrete Fit options in the red triangle menu), create the Capability Analysis report by selecting Spec Limits from the red triangle menu in the Fit Distributionsreport.
|
The Capability Analysis window appears when you select the Capability Analysis option from the red triangle menu next to the name of the analysis variable and the corresponding column does not contain a Spec Limits column property. For an example of using this window, see Example of Capability Analysis.
Figure 2.12 Capability Analysis Window
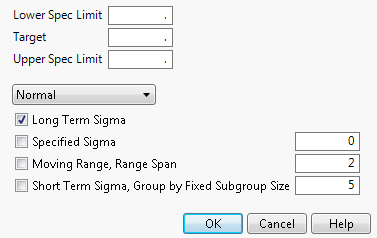
<Distribution type>
Note: If you specify a distribution other than Normal, the selections for sigma are ignored. The fitted distribution report contains a Quantile Sigma report that estimates sigma as the square root of the variance of the fitted distribution. For more information about the relationship between the parameters in the Parameter Estimates report and the expected value and variance of the fitted distributions, see Continuous Fit Distributions and Discrete Fit Distributions.
For more information about the calculations for the long term sigma, moving range sigma, and the short term sigma, see Variation Statistics.
Note: By default, the capability indices in the Long Term Sigma report use the Cp labeling that is used in the other sigma reports. To use Ppk labeling in the Long Term Sigma report, select the File > Preferences > Platforms > Distribution > PpK Capability Labeling preference.
Sigma Quality is frequently used in Six Sigma methods, and is also referred to as the process sigma. For more information about the calculation of the Sigma Quality values, see Sigma Quality Statistics.
(Available only in Capability Analysis reports that are not inside a Fitted <distribution> report.) Shows the values (represented by Index) of the Benchmark Z statistics. According to the AIAG Statistical Process Control manual, Z represents the number of standard deviation units from the process average to a value of interest, such as an engineering specification. When used in capability assessment, Z USL is the distance to the upper specification limit and Z LSL is the distance to the lower specification limit. For more information about the calculation of the Benchmark Z values, see Benchmark Z Statistics.
|
•
|
For the Process Capability platform, see Process Capability in the Quality and Process Methods book.
|