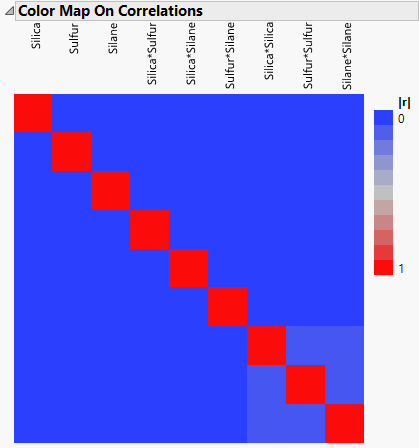
Figure 14.24 shows the Color Map on Correlations for the Bounce Data.jmp sample data table, found in the Design Experiment folder. The deep red coloring indicates absolute correlations of one. Note that there are red cells on the diagonal, showing correlations of model terms with themselves.
Figure 14.24 Color Map on Correlations
Tip: To save a table of the correlations, right click to the right of the plot below the legend and select Table of Correlations.