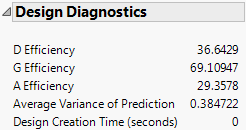
The Design Diagnostics outline shows D-, G-, and A-efficiencies and the average variance of prediction. These diagnostics are not shown for designs that include factors with Changes set to Hard or Very Hard or effects with Estimability designated as If Possible.
Figure 14.25 shows the Design Diagnostics outline for the Bounce Data.jmp sample data table, found in the Design Experiment folder.
Figure 14.25 Design Diagnostics Outline
|
•
|
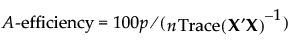
X is the model matrix
|
|
•
|
n is the number of runs in the design
|
|
•
|
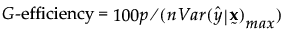
p is the number of terms, including the intercept, in the model
|
|
•
|
 is the relative prediction variance at the point
  . See
. See  is the maximum relative prediction variance over the design region
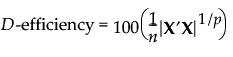
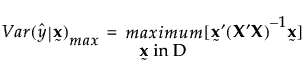
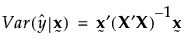
 in the design space, the relative prediction variance is defined as: