Tip: In the Scripting Index (Help > Scripting Index), display boxes that cannot be constructed are marked by  . Display boxes that you can construct are marked by
  .
.
|
•
|
The Dialog() function, which creates modal windows, is deprecated and will not work at all in future versions of JMP. Use either New Window() with the Modal message or Column Dialog() for column selection. See Construct a Column Dialog and Convert Deprecated Dialog to New Window for more information.
|
|
•
|
In JMP, the following display boxes support only one direct child box: Border Box(), Center Box(), If Box(), Mouse Box(), Scroll Box(), and Sheet Panel Box(). To make a border box that appears to have multiple children, use a V List Box() or H List Box() as the only child and put multiple children in the V List Box() or H List Box().
|
Border Box() adds space around the displaybox argument.
Border Box (Left( pix ), Right( pix ), Top( pix ), Bottom( pix ), Sides( int ), display box args);
Left, Right, Top, and Bottom add space around the displaybox argument. Sides draws a border around the box, as described in Table 10.2. Additional effects can also be applied to the borders using Sides, as described in Table 10.2. To add both an effect and a border, add the two numbers.
win = New Window( "Borders",
bb = Border Box( Sides( 5 ), // top and bottom border
Text Box( "Hello World!" )
)
);
bb << Set Color( "red" ); // set the border color to red
The bb variable is assigned to the border box so that the color can be set on the last line.
Note: Border boxes support only one display box argument. To make a border box that appears to have multiple children, use a V List Box() or H List Box() as the only child and put multiple children in the V List Box() or H List Box().
In the Sides() function, add the following values to get the borders that you want. For example, “5” draws a top and a bottom border.
Border Box() provides the additional effects described in Table 10.2.
Col List Box() returns a display box that shows a list of current data table columns.
Col List Box( <Data Table( <name> ), <all>|<character>|<numeric>, <Width( n )>, <Max Selected( n )>, <NLines( n )>, <Max Items( n )), <Min Items( n )>, <On Change( expression )>, <script> );
All specifies that all columns in the current data table should be included, or you can include only character or numeric columns. Width is measured in pixels. Max Selected is the maximum number of items that might be selected in the list box. NLines is the number of lines displayed in the box. Max Items is the maximum number of items displayed in col list box. Min Items is the minimum number of items displayed in the col list box. On Change is the script that runs when the selection changes.
You can send a Get Items message to a col list box to retrieve a list of all columns selected. Here is an example script showing Get Items in use. See the Scripting Index in the Help menu for other messages and examples.
dt = Open( "$SAMPLE_DATA/Big Class.jmp" );
win = New Window( "Get Items Demonstration",
H List Box(
chooseme =
Col List Box( "All", width( 100 ), NLines( 6 ) ),
// Col List Box shows all columns, 100 pixels wide with 6 lines
Line Up Box( N Col( 1 ), Spacing( 2 ),
// line up box arranges button boxes in 1 column
// with 2 pixels of space around the boxes
Button Box( "Add Column >>",
listcols << Append( chooseme << Get Selected );
// append the selected column to previously
// selected columns
Chosen Columns = listcols << Get Items;
// get a list of selected columns from the col list box
),
Button Box( "<< Remove Column",
listcols << Remove Selected; // remove the selected column
Chosen Columns = listcols << Get Items; // get the selected column
),
),
listcols = Col List Box( width( 100 ), NLines( 6 ) ),
// create another col list box with no columns inside
),
Text Box( " " ),
stuff = Global Box( Chosen Columns )
// at the bottom of the h list box,
// show which columns Get Items returned
);
The All argument for Col List Box() includes all data table columns in the display box. Because all columns are required, you cannot remove selected rows using Remove Selected or Remove All. Instead, create an empty column list box and append all columns. Then the columns that you select can be removed.
dt = Open( "$SAMPLE_DATA/Big Class.jmp" );
colNames = dt << Get Column Names; // get a list of column names
New Window( "Example",
myBox = Col List Box( width( 200 ), nlines( 10 ) ) );
myBox << Append( colNames );
// create Col List Box with all the column names from the data table
myBox << Set Selected( 3 ); // select one or all of the entries in myBox
myBox << Remove Selected(); // remove selected entries in myBox
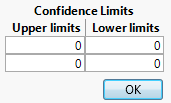
Col Span Box() creates spanned columns headers inside a table box. The top column header spans two child column headers.
Col Span Box( "title", display box args);
win = New Window( "Col Span Box",
<<Modal,
Table Box(
Col Span Box(
"Confidence Limits",
neb = Number Col Edit Box( "Upper limits", [0, 0] ),
Number Col Edit Box( "Lower limits", [0, 0] )
)
)
);
Figure 10.9 Confidence Limits
H List Box() aligns boxes horizontally.
H List Box( <Align( center|bottom )>, display box args, ...);
Align specifies center or bottom alignment of the contents in the display box. The contents are top aligned by default.
win = New Window( "H List Box",
<<Modal,
H List Box(
kb1 = Check Box( "a" ),
kb2 = Check Box( "b" ),
kb3 = Check Box( "c" )
),
);
V List Box() aligns boxes vertically.
V List Box( <Align( center|right )>, display box args, ...);
Align specifies left, right, or center alignment of the contents in the display box. The contents are left aligned by default.
win = New Window( "V List Box",
Text Box( "Select your favorite fruit." ),
V List Box(
Check Box( "apple" ),
Check Box( "banana" ),
Check Box( "orange" ),
),
);
dt = Open( "$SAMPLE_DATA/Big Class.jmp" );
New Window( "Example",
H List Box(
ll1 = Filter Col Selector( ),
Button Box( "Add", ll2 << Append( ll1 << Get Selected() ) ),
ll2 = Col List Box( "Numeric", MaxItems( 1 ), nlines( 1 ) ),
Button Box( "Remove", ll2 << Remove Selected )
)
);
Note: Transform columns use formulas or calculations to define the column values. Closing the window deletes any transform columns. See Transform Columns in the Using JMP for details.
If Box() creates a display box whose contents are conditionally displayed.
If Box( 0|1, display box args );
The following script creates a splitter box with three scroll boxes. The second scroll box is enclosed in If Box(). Because If Box() is set to 1, the second scroll box appears in the window.
win = New Window( "If Box",
H Splitter Box(
Size( 500, 250 ),
Scroll Box(),
If Box( 1, Scroll Box() ), // if box sets the scroll box to show
Scroll Box()
)
);
When you set an if box to be hidden, then anything within the if box disappears from the report window. In the tree structure view, the hidden display box is no longer numbered. Hide the if box in this example, and the second scroll box is no longer numbered in the tree structure view. Scroll Box(3) becomes Scroll Box(2). Change the argument for If Box() in this script from 1 to 0 and then send the win << Show Tree Structure message to see the structure view.
H Splitter Box() and V Splitter Box() create a display box that arranges the display boxes provided by the arguments in a horizontal or vertical layout (or panel). The splitter enables the user to interactively resize the panel.
H Splitter Box( <Size( h,v )>, display box args, <arguments> );
V Splitter Box( <Size( h,v )>, display box args, <arguments> );
Size( h, v ) specifies the size of the splitter box in pixels. Inner display boxes are proportionately sized according to the width and height of the splitter box. For a list of arguments, see the Scripting Index in the JMP Help menu.
dt = Open( "$SAMPLE_DATA/Big Class.jmp" );
win = New Window( "H Splitter Box",
H Splitter Box(
Size( 900, 600 ),
biv = dt << Bivariate( Y( :weight ), X( :height ), Fit Line(), Line Style( Dotted ) ),
one = Oneway( Y( :height ), X( :sex ), Name( "Means/Anova" )( 1 ), Mean Diamonds( 1 ) )
)
);
(biv << Report)[FrameBox( 1 )] << Set Auto Stretching( 1, 1 );
(one << Report)[FrameBox( 1 )] << Set Auto Stretching( 1, 1 );
// make a reference to the report layers
// set the x and y axes on the frame boxes to auto stretch
// when the user drags the splitter
Line Up Box() shows the display box arguments in n columns. You can specify optional spacing, in pixels, for the space between columns.
Line Up Box( NCol( n ), <Spacing( pixels )>, display box args, ... );
Spacing specifies the number of pixels around the box.
dt = Open( "$SAMPLE_DATA/Big Class.jmp" );
win = New Window( "Line Up Box",
Line Up Box( NCol( 6 ), // line up the Distributions in 6 columns
dist = Distribution(
Continuous Distribution( Column( :height ) ),
By( :age )
)
)
);
Outline Box() creates a display box to hold other display boxes and show them in an outline view.
Outline Box("title", display box args, ... );
dt = Open( "$SAMPLE_DATA/Big Class.jmp" );
win = New Window( "Outline Box",
obj1 = Outline Box( "Age and Weight",
Distribution( Column( :age, :weight ) ),
),
obj2 = Outline Box( "Weight and Height",
Distribution( Column( :weight, :height ) )
)
);
To close an outline by default, send the Close( 1 ) message to the outline object.
obj2 << Close( 1 );
sliderValue = .6;
win = New Window( "Outline Box",
Panel Box( "Slider Box",
tb = Outline Box( "Value: " || Char( sliderValue ) ),
sb = Slider Box(
0,
1,
sliderValue,
tb << Set Title( "Value: " || Char( sliderValue ) )
)
)
);
To make your own red triangle menu within an outline box, send the Set Menu Script message to the outline box reference. The following example also uses the Set Submenu message to create nested menu items.
win = New Window( "Red Triangle Menu Items",
ob = Outline Box( "Outline Box" ) );
ob << Set Menu Script(
{"A", "", "A1", Print( "A1" ), "A2", Print( "A2" ), "B", "",
"B1", Print( "B1" ), "B2", Print( "B2" ), "B3",
Print( "B3" ), "C", Print( "C" ), "Selected", Print( "Selected" )}
);
ob << Set Submenu( 1, 2 ); // menu A with 2 items in submenu A1 and A2
ob << Set Submenu( 4, 3 ); // menu B with 3 items in submenu B1, B2, and B3
To indicate whether an item is selected, unavailable, or available, include Set Menu Item State. The following expression shows a check mark beside the ninth menu item (“Selected”) in the preceding script.
ob << Set Menu Item State( 9, 1 );
Panel Box() encloses the displaybox argument in a labeled border.
Panel Box("title", display box args );
dt = Open( "$SAMPLE_DATA/Big Class.jmp" );
win = New Window( "Panel Box",
H List Box( Panel Box( "My Distribution", Distribution() ) )
);
Graph Box() constructs a display box that contains a frame box and axes.
Graph Box( "title", <X Scale( low, high ), <Y Scale( low, high )>, <Frame Size( h, v )>,< <XName( "name" )>, <YName( "name" )>, <SuppressAxes>, script );
X Scale() and Y Scale() specify the lower and upper limits of the x and y axes. Frame Size() specifies the size of the frame around the graph. XName and YName specify the name of the x and y axes.
win = New Window( "Graph Box",
Graph Box(
Frame Size( 300, 300 ),
Marker( Marker State( 3 ), [11 44 77], [75 25 50] );
Pen Color( "Blue" );
Line( [10 30 70], [88 22 44] );
)
);
win = New Window( "Graph Box",
Graph Box(
Frame Size( 300, 300 ),
xaxis( // remove tick marks from the x axis
Show Major Ticks( false ),
Show Minor Ticks( false ),
Show Labels( false )
),
yaxis( // remove tick marks from the y axis
Show Major Ticks( false ),
Show Minor Ticks( false ),
Show Labels( false )
),
Marker( Marker State( 3 ), [11 44 77], [75 25 50] );
Pen Color( "Blue" );
Line( [10 30 70], [88 22 44] );
)
);
JMP provides a robust set of features to make your graphs interactive (such as dragging objects or capturing mouse clicks). The Scripting Graphs topic describes graph box options in detail.
Sheet Box() lets you create a grid of plots. H Sheet Box() and V Sheet Box() contain display boxes and arrange them in columns and rows.
H Sheet Box( <<Hold( report ), display box args );
V Sheet Box( <<Hold( report ), display box args );
The general approach is to first consider which display boxes you want and in which arrangement. Create either an H or V Sheet Box and send it a Hold message for each graph to specify which element the sheet box should hold. Finally, create interior H or V Sheet Boxes and tell each one which graph the sheet box should hold.
dt = Open( "$SAMPLE_DATA/Big Class.jmp" );
nw = New Window( "Sheet Box Example",
Use a V Sheet Box to organize the window into two columns.
V Sheet Box(
<<Hold(
dt << Bivariate( // graph 1
Y( :weight ),
X( :height ),
Fit Line()
)
),
<<Hold(
Distribution( // graph 2
Continuous Distribution(
Column( :height ),
Horizontal Layout( 1 ),
Outlier Box Plot( 0 )
)
)
),
<<Hold( Treemap( Categories( :age ) ) ), // graph 3
<<Hold(
Bubble Plot( // graph 4
X( :height ),
Y( :weight ),
Sizes( :age ),
Coloring( :sex ),
Circle Size( 6.226 ),
All Labels( 0 )
)
),
Finally, add two H Sheet Boxes to the V Sheet Box and tell each one which graph it should hold. Each H Sheet Box holds two side-by-side graphs. They are held by a V Sheet Box, so the H Sheet Boxes are displayed vertically.
H Sheet Box(
Sheet Part(
"",
Sheet Part displays a previously defined graph, held by Excerpt Box. The first argument is the number of the graph, determined by the order in which you defined the graphs. The first H Sheet Box contains the Bivariate graph on the left and the Distribution on the right. {Picture Box( 1 )} designates which picture box from the report to display. Typically, use 1, the first picture box in the report.
Excerpt Box( 1, {Picture Box( 1 )} ) // excerpt box 1
),
Sheet Part(
"Distribution of height",
Excerpt Box( 2, {Picture Box( 1 )} ) // excerpt box 2
)
),
H Sheet Box(
Sheet Part(
"",
Excerpt Box( 3, {Picture Box( 1 )} ) // excerpt box 3
),
Sheet Part(
"My Title Here",
Excerpt Box( 4, {Picture Box( 1 )} ) // excerpt box 4
)
)
)
);
The Sheet Part() title is required. If you include an empty string as the title, the sheet part’s title is the default report title, for example, “Bivariate Fit of weight By height”.
The Journal Box() constructs a display box from instructions that are stored in a journal.
box = Journal Box("journal text");
where "journal text" is text that has been extracted from a journal file.
We highly recommend that you use the "\[ ... ]\" quoting mechanism so that you do not have to escape double quotes within the journal text. This excerpt shows how to escape the journal text:
win = New Window( "Mosaic Plot",
Journal Box(
"\[ // beginning of quoting mechanism
...display box arguments...
]\"
) // end of quoting mechanism
);
Another way to get journal text is to send the Get Journal message to a display box. For example, run the following script and copy the journal text from the log into the Journal Box() function:
dt = Open( "$SAMPLE_DATA/Big Class.jmp" );
biv = dt << Bivariate( y( :weight ), x( :height ) );
rbiv = biv << Report;
Print( rbiv << Get Journal ); // prints the journal to the log
dt = Open( "$SAMPLE_DATA/Big Class.jmp" );
biv = dt << Bivariate( y( :weight ), x( :height ) );
rbiv = biv << Report;
rbiv << Get Picture;
The Expr As Picture() function evaluates its argument and creates a picture of the expression, using the same formatting mechanism as the Formula Editor. If you have a literal expression as the argument, remember to enclose it in Expr() so that JMP just takes a picture of the result. The expression then is not evaluated.
win = New Window( "Formula",
Expr As Picture( Expr( a + b * c + r / d + Exp( x ) ) )
);
|
•
|
Write the picture to a file using Save Picture().
|
picture << Save Picture( "path", type );
Pref( Save Image DPI( <number> ) );
Input selector display boxes enable users to enter information and interact with the display box. The display box script includes a script that runs when the user interacts with the display box. See Set Function and Set Script for details about writing the scripts.
Button Box() draws a button that contains text.
Button Box("text", <script>);
win = New Window( "Set the Value",
<<Modal,
Text Box( "Set this value" ),
variablebox = Number Edit Box( 42 ),
Button Box( "OK" ),
Button Box( "Cancel" ) );
Note that a modal window must have at least one button. If you omit the Button Box() from your script, an OK button is automatically included. To omit the OK button, set the visibility to collapse.
win = New Window( "No OK Button",
<<Modal,
b = Button Box( "Close Window", b << Close Window ),
bb = Button Box( "OK", <<Visibility( "collapse" ) )
);
You can add a tooltip for a button by sending a Set Tip message to it. The following script creates a button named “Submit”. A tooltip that contains “Send my information.” appears when you place your cursor over the button.
Button Box( "Submit", << Set Tip( "Send my information." ) );
You can also send the message Open Next Outline as a script command, which causes the next outline box to open. If you are sending more than one message to the button box, this must be the first command listed. When the user clicks the next button in this example, the second outline box opens.
win = New Window( "Open Next Outline",
Outline Box( "First",
ex = Button Box( "Next", ex << Open Next Outline )
),
Outline Box( "Second", Text Box( "Last" ), << Close )
);
Using the Set Menu Items message, you can create a button that contains a menu:
win = New Window( "Set and Get Menu Choice",
bb = Button Box( "Select a dessert",
// get menu choices when button is clicked
choice = bb << Get Menu Choice;
Show( choice );
)
);
bb << Set Menu Items( {"fruit", "no thank you", "-", "chocolate bar", "ice cream"} );
The "-" in the preceding script creates a menu separator. The separator counts as an item in the list. If you select chocolate bar from the menu, 4 is returned, not 3.
To indicate whether an item is selected, unavailable, or available, include Set Menu Item State. The following example makes the fifth menu item (“ice cream”) in the preceding script unavailable:
bb << Set Menu Item State( 5, -1 );
Note that, after you click the button, the button box doesn’t know where the script is stored because the button is disconnected from the script. For example, relative paths don’t work when executed from a button box because of this disconnection. An Open() script must evaluate the current directory and concatenate it to the relative file path to construct an absolute path.
nw = New Window( "Open File Example",
Button Box( "Open",
Open(
Eval( Get Path Variable( "$SAMPLE_DATA" ) ) ||
"Quality Control/Coating.jmp"
)
)
);
However, if you put the following script in your root directory, the Open() expression works; the path is interpreted as an absolute path beginning with the root.
nw = New Window( "Example",
Button Box( "Open", Open( "/MyData/Big Class.jmp" ) ) );
Check Box() constructs a display box to show one or more check boxes. Any number of the check box items can be selected simultaneously.
Check Box ({"item 1", "item 2", ...}, <script>);
The following example shows how to get the user’s selection by sending the Get Selected message to the check box. Each selection is printed to the log.
win = New Window( "Check Box",
cb = Check Box(
{"apple", "banana", "orange"},
scb = cb << Get Selected();
Show( scb );
)
);
scb = {"banana", "orange"};
win = New Window( "Check Box",
<<Modal,
<<On Close(
GetData = ckbox <<Get( 1 );
GetEvents = ckbox <<Get( 2 );
1; // On Close returns non-zero, so the window closes.
),
ckbox = Check Box( {"Check Box 1", "Check Box 2"} ),
ckbox << Set( 1, 1 ),
ckbox << Set( 2, 0 )
);
Combo Box() creates a drop-down list.
Combo Box( {"item 1", "item 2", ...}, <script> );
The Editable argument allows the user to enter text in the combo box. The following example creates a new window and an editable combo box with the list items “one”, “two”, and “three”. The script prints the selected item name and index number to the log.
win = New Window( "Combo Box",
cb = Combo Box(
{"One", "Two", "Three"},
Editable,
selection = cb << GetSelected();
Print( "Selected: " || selection );
Print( "Index: " || Char( cb << Get() ) );
)
);
Note that closing the window for an editable combo box can produce unexpected results. On Windows, the Print() script runs after you select an item from the list or enter the item name. On Macintosh, the Print() script runs after you select an item from the list or enter the item name and then press Return.
For cross-platform compatibility, include !Is Empty to test for an existing combo box before running the script.
win = New Window( "Combo Box",
cb = Combo Box(
{"One", "Two", "Three"},
Editable,
If( !Is Empty( cb ),
selection = cb << GetSelected();
Print( "Selected: " || selection );
Print( "Index: " || Char( cb << Get() ) );
)
)
);
cb << Enable Item( 2, 0 ) // makes the second item unselectable
Global Box shows the name and current value of a JSL global variable.
Global Box( name );
ex = Sqrt( 4 );
win = New Window( "Global", Global Box( ex ) );
ex=2
myGlobal = 6;
win = New Window( "Global Box",
V List Box(
gr = Graph Box(
Frame Size( 300, 300 ),
X Scale( 0, 10 ),
Y Scale( 0, 10 ),
Y Function( x, x ),
Text( {5, 5}, "My global is ", myGlobal )
),
Global Box( myGlobal ) // value of myGlobal
)
);
Note: When you are using Global Box(), remember that every time the variable is changed, MP remeasures, reshows, and updates the window. Depending on the number of Global Box() objects, changes to the variable can affect the refresh rate of the window. JMP recommends avoiding numerous global boxes in deliverable scripts. Global boxes can be replaced with text boxes that the script can manually update when necessary.
List Box() creates a display box that shows a list box of items that can be selected.
List Box({"item 1", "item 2", ...}, <Width( n )>, <MaxSelected( n )>, <NLines( n )>, <script>);
Item names are case sensitive by default. Width is measured in pixels. MaxSelected is the maximum number of items that might be selected in the list box. NLines is the number of lines to display in the box, with a default value of 3.
win = New Window( "test", lb = List Box( {"a", "e"} ) );
lb << Append( {"f", "g"} ); // result is a, e, f, g
lb << Insert( {"b", "c", "a", "d"}, 1 ); // result is a, b, c, d, e, f, g
Append always adds the list to the end of the list box. Insert adds the list after the position specified.
You can have two mutually exclusive list boxes, so that the item you select in one box is deselected when you select an item in the other box. Send the Clear Selection message to deselect the item.
win = New Window( "Each Box Clears the Other Box",
window:la = List Box(
{"broccoli", "pepper", "spinach"},
<<Set Script( window:lb << Clear Selection )
),
window:lb = List Box(
{"avocado", "pumpkin", "tomato"},
<<Set Script( window:la << Clear Selection )
)
);
win = New Window( "List Box with Image",
List Box(
{{"first", "$SAMPLE_IMAGES/pi.gif"}, {"second", "nominal"}},
width( 200 ),
)
);
To set the width of the list box, use the width argument.
listA = {"a", "b", "c",
"This is a very, very long name like Mary Ann Johnston."};
New Window( "Example",
V List Box( listBoxA = List Box( listA, width( 0 ) ) ) );
Mouse Box() creates a box that can make JSL callbacks for dragging and dropping, marking, or clicking and tracking mouse actions.
Mouse Box( display box args, messages );
The following example is from the DragDrop.jsl sample script in the Samples/Scripts folder. One list box contains “a”, “b”, and “c”. The other list box contains “d”, “e”, “f”. You can drag a letter from one list box to the other list box.
win = New Window( "Drag and drop between list boxes",
H List Box(
MouseBox(
one = List Box( {"a", "b", "c"} ),
// if the mouse is over this list box, drop on the other box
<<setTrack(
(two << parent) << setDropEnable( 1 );
(one << parent) << setDropEnable( 0 );
),
// watch the mouse movement (not clicks).
<<setTrackEnable( 1 ),
// when a drop happens...
<<setDropCommit(
Function( {this, clickPt, text},
// find out what is selected in the other box
x = two << getSelected;
If( Words( text, "\!t" ) == x,
two << removeSelected; // and take it...
one << append( x ); // and add it to me.
,
Print( "Drag from the other box please." )
);
)
)
),
Spacer Box( size( 20, 20 ) ),
// same comments as above with reversed logic
// for current box versus other box.
MouseBox(
two = List Box( {"d", "e", "f"} ),
<<setTrack(
(one << parent) << setDropEnable( 1 );
(two << parent) << setDropEnable( 0 );
),
<<setTrackEnable( 1 ),
<<setDropCommit(
Function( {this, clickPt, text},
x = one << getSelected;
If( Words( text, "\!t" ) == x,
one << removeSelected;
two << append( x );
,
Print( "Drag from the other box please." )
);
)
)
)
)
);
Number Col Edit Box() creates a display box that shows editable numbers in a column. The numeric entries can be in list or matrix form.
Number Col Edit Box("title", numbers);
The following script creates number edit boxes in which the user enters values. The Return Result message extracts the values.
x = y = z = 0;
win = New Window( "Number Col Edit Box",
<<Modal,
<<Return Result,
Table Box(
neb = Number Col Edit Box( "values", {x, y, z} )
)
);
{neb = {2, 4, 6}, Button( 1 )}
Number Edit Box() creates an editable number box that initially contains the value argument. You can also set the width of the box in characters.
Number Edit Box( initValue, <width>);
win = New Window( "Set a Value in Number Edit Box",
<<Modal,
<<Return Result,
Text Box( "Set this value" ),
variablebox = Number Edit Box( 42 ),
Button Box( "OK" ),
Button Box( "Cancel" )
);
Write( win["variablebox"] );
// create a subscript to the variablebox variable
33 // the user typed "33" in the number edit box
New Window( "Date/Time Selector",
<<Modal,
neb = Number Edit Box(
Today(),
23,
<<Set Format( Format( "m/d/y h:m:s", 23, 0 ) )
)
);
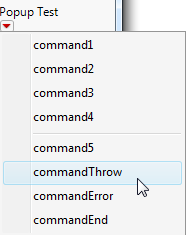
Popup Box() creates a red triangle menu that contains menu item commands.
Popup Box( {"command1", script1, "command2", script2, ...} );
The following example stores a command list in a variable and then uses Popup Box() to display the items:
List = {
"command1", Print( "command1" ),
"command2", Print( "command2" ),
"command3", Print( "command3" ),
"command4", Print( "command4" ),
"", Empty(), // make a separator line
"command5", Print( "command5" ),
"commandThrow", Throw( "commandThrow1" ),
"commandError", Sqrt( 1, 2, 3 ),
"commandEnd", Print( "commandEnd" )};
win = New Window( "Example",
Text Box( "Popup Test" ),
Popup Box( List );
);
Figure 10.10 Red Triangle Menu
Note that you can disable and re-enable the menu using the Enable( Boolean ) message. An argument of 1 turns the menu on, and an argument of 0 turns the menu off. Using the previous example, assign the popup box to a variable and then send messages to it:
win = New Window( "Example",
Text Box( "Popup Test" ),
mymenu = Popup Box( List );
);
mymenu << Enable( 0 ); // disabled menu
You can also add a popup menu to an outline box. See Outline Box for an example.
Radio Box() creates a list of radio buttons.
Radio Box({"item 1", "item 2", ...}, <script>);
win = New Window( "Radio Box",
V List Box(
rb = Radio Box( {"A", "B", "C"}, <<Set( 2 ) ),
)
);
New Window Example also provides an example of creating radio boxes.
Slider Box() creates a slider control for picking any value for the variable, within the minimum and maximum range that you specify.
Slider Box( min, max, global variable, script, <Set Width( n )>, <Rescale Slider( min, max )> );
Set Width specifies the width of the slider box. Rescale Slider specifies the minimum and maximum values.
When the slider is moved, the value given by the current position of the slider is assigned to the global variable. Thus, Slider Box() is another way to parameterize a graph.
ex = .5;
win = New Window( "Slider Box",
tb = Text Box( "Value: " || Char( ex ) ),
sb = Slider Box(
0,
1,
ex,
tb << Set Text( "Value: " || Char( ex ) )
)
);
sb << Set Width( 100 ) << Rescale Slider( 0, .8 );
sb1 = Slider Box( 1, 10 );
sb2 = Slider Box( -10, 10 );
// create a slider box with only the min and max value
sb1 << Set Function( // set the script or the function
Function( {this},
{},
Show( this << Get, sb2 << Get )
)
);
sb2 << Set Script( Show( sb2 << Get, sb1 << Get ) );
New Window( "Values", sb1, sb2 ); // place the slider boxes in a window
See Example of Slider Boxes and Range Slider Boxes for another example of slider boxes.
Spacer Box() creates space between display boxes.
Spacer Box(<size(horizontal_pixels,vertical_pixels)>, <color(color)>)
dt = Open( "$SAMPLE_DATA/Big Class.jmp" );
win = New Window( "Spacer Box",
V List Box(
Outline Box( "Bivariate",
biv = dt << Run Script( "Bivariate" ),
Spacer Box( Size( 450, 15 ), Color( {.53, .80, .98} ), )
// Color string consists of percentages of RGB values
),
Outline Box( "Distribution",
V List Box( dist = dt << Run Script( "Distribution" ), )
)
)
);
Figure 10.11 Spacer Box Example
String Col Edit Box() creates a column named title in a table containing the string items listed. The string boxes are editable.
String Col Edit Box( "title", {strings} );
a = b = c = "";
win = New Window( "String Col Edit Box",
<<Modal,
<<Return Result,
Table Box(
seb =
String Col Edit Box(
"Names",
{a, b, c}
)
)
);
{seb = {"apple", "orange", "banana"}, Button( 1 )}
Tab Page Box() organizes the title and contents of the page in one display box. When Tab Page Box() is inside Tab Box(), a tabbed window with multiple tabbed pages appears.
Tab Box( Tab Page Box( Title( "page title 1" ), [options], contents of page 1), Tab Page Box( "page title 2", [options], contents of page 2), ...);
win = New Window( "Tab Box",
Tab Box(
Tab Page Box(
Title( "First page" ),
Text Box( "first line of first page" ),
Text Box( "second line of first page" )
),
Tab Page Box(
Title( "Second page" ),
Text Box( "first line of second page" ),
Text Box( "second line of second page" )
),
Tab Page Box(
Title( "Third page" ),
Text Box( "first line of third page" ),
Text Box( "second line of third page" )
)
)
);
Figure 10.12 Tab Boxes
You can specify which tab should be selected by sending the Set Selected( n ) message, where n is the tab number, to the tab box object.
The Set Style message lets you select the visual appearance of the tab box. The default value is tab. Other options include the following:
|
•
|
combo creates a combo box.
|
|
•
|
outline creates an outline node.
|
|
•
|
vertical spread displays the tab title vertically.
|
|
•
|
horizontal spread displays the tab title horizontally.
|
|
•
|
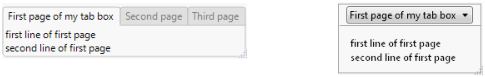
minimize size bases the tab style on the width of the tab title. In the following example, the first tab title is fairly long:
|
win = New Window( "Tab Box",
tb = Tab Box(
Tab Page Box(
Title( "First page of my tab box" ),
Text Box( "first line of first page" ),
Text Box( "second line of first page" )
),
Tab Page Box(
Title( "Second page" ),
Text Box( "first line of second page" ),
Text Box( "second line of second page" )
),
Tab Page Box(
Title( "Third page" ),
Text Box( "first line of third page" ),
Text Box( "second line of third page" )
)
)
);
tb << Set Style( "minimize size" );
Minimizing the size of the tab box converts the tab box into a combo box. Figure 10.13 compares the default and minimized tab boxes.
Figure 10.13 Default Tab Box (Left) and Minimized Tab Box (Right)
|
•
|
Unlike with other display boxes, you must define the title in the Title() function.
|
|
•
|
The Set Style message works for both bare words and quoted words. However, you cannot assign the style to a variable and then pass the variable as the argument.
|
|
•
|
You can combine Tab Box() with Splitter Box() to create docked tabs, which can be dragged to drop zones in a window to create a different layout. See Examples of Creating a Dashboard from Two Reports for details.
|
|
•
|
To delete a tab, you can either send Delete(index) to the tab box, or you can send Delete Box() to a tab page box. Note that the entire display box (all tabs) is deleted, not just a single tab.
|
|
•
|
Use the Visibility("Collapsed") message to hide a tab.
|
|
•
|
When tabs in a tab list are not wide enough for the titles, send the Set Overflow Enabled(1) message to Tab Box(). A “^” symbol is shown to the right of a tab list, and the tab titles are truncated using ellipses.
|
|
•
|
When Tab Page Box() is created or dragged outside a Tab Box(), it is a stand-alone container. The title appears in a shaded box at the top of the page, similar to the title in Sheet Part(); the title does not appear in an interactive tab.
|
|
•
|
See Write Tab Box and Tab Page Box Scripts for details about the differences between Tab Box() and Tab Page Box().
|
|
•
|
In Bubble Plot and Graph Builder scripts, set the Fit to Window message to "On" to resize the window when you resize the graph in Tab Box().
|
|
•
|
To close a tab, first make a tab closeable by sending Closeable(1) to the tab page box and then send the Close message.
|
Text Box() creates a non-editable text box. Text boxes are frequently used as labels of other controls.
Text Box( "text" );
win = New Window( "Formatted Text",
Text Box( "This is <b>bold</b> text.",
<<Markup) );
"This is <b><i><u>bold italic</u></i></b> text."
Note: Rotated text boxes support Markup text except for larger text boxes with multiple lines, multiple formats or justifications applied.
Text Edit Box() creates an editable text box.
Text Edit Box ( "text" );
win = New Window( "Text Edit Box",
Text Edit Box( "Change Me", <<Script( Print( "Changed" ) ) )
);
win = New Window( "Text Edit Box",
teb = Text Edit Box( "Change Me",
<<Script( Print( teb << Get Text ) )
)
);
The following example produces the text edit box shown in Figure 10.14. The Hint option returns "mm/dd/yyyy" and formats it as light gray text.
win = New Window( "Text Edit Box",
Text Edit Box( "Current Date" ),
Text Edit Box( "", Hint( "mm/dd/yyyy" ) )
);
Figure 10.14 Text Edit Box with Placeholder Text

Tip: To omit the border around the editable box and the white background color, send the White Box Style( 0 ) message to the text edit box.
win = New Window( "Text Edit Box",
teb = Text Edit Box( "a",
Password Style( 1 ),
Set Script( Print( "Changed!" ) )
)
);
q << Password Style( 1 ); // set the text edit box to password style
q << Password Style( 0 ); // set the text edit box to standard style
Data Filter Source Box() and Data Filter Context Box() work together to filter data in multiple graphs. Data Filter Source Box() defines which graph is the “source” of the selection filter. When data are selected in the source graph, graphs in the common Data Filter Context Box() are updated.
Data Filter Context Box() creates a display box that enables you to filter data in multiple graphs. The function determines the number of graphs that the filter applies to, for example, all graphs in a report.
Data Filter Context Box( display box args );
In the following example, the H List Box() that contains the graphs is wrapped in Data Filter Context Box(). After you run the script, select values in the filter to see both graphs update.
dt = Open( "$SAMPLE_DATA/Hollywood Movies.jmp" );
win = New Window( "Shared Local Filter",
Data Filter Context Box(
// enclose the h list box that contains distribution and graph builder
H List Box(
dt << Data Filter( Local ), // add the local data filter
dt << Distribution(
Weight( :Profitability ),
Nominal Distribution( Column( :Lead Studio Name ) ),
Nominal Distribution( Column( :Genre ) ),
Histograms Only
),
dt << Graph Builder(
Variables(
X( :Genre ),
Y( :Domestic Gross ),
Y( :Foreign Gross, Position( 1 ) )
),
Show Control Panel( 0 ),
Elements(
Bar(
X,
Y( 1 ),
Y( 2 ),
Legend( 2 ),
Bar Style( "Side by side" ),
Summary Statistic( "Mean" )
),
Frequencies( 0 ),
)
)
)
)
);
Data Filter Source Box() and Data Filter Context Box() work together to filter data in multiple graphs. Data Filter Source Box() defines which graph is the “source” of the selection filter. When data are selected in the source graph, graphs in the common Data Filter Context Box() are updated.
Data Filter Source Box( display box args );
dt = Open( "$SAMPLE_DATA/Hollywood Movies.jmp" );
win = New Window( "Shared Local Filter",
Data Filter Context Box(
// enclose data filter source box and the graph builder platform
H List Box(
Data Filter Source Box(
dt << Distribution( // use distribution as the source graph
Weight( :Profitability ),
Nominal Distribution( Column( :Lead Studio Name ) ),
Nominal Distribution( Column( :Genre ) ),
Histograms Only
)
),
dt << Graph Builder(
Variables(
X( :Genre ),
Y( :Domestic Gross ),
Y( :Foreign Gross, Position( 1 ) )
),
Show Control Panel( 0 ),
Elements(
Bar(
X,
Y( 1 ),
Y( 2 ),
Legend( 2 ),
Bar Style( "Side by side" ),
Summary Statistic( "Mean" )
),
Frequencies( 0 ),
)
)
)
)
);
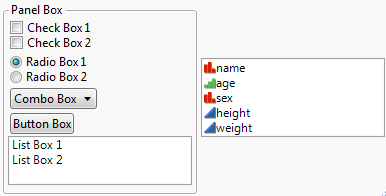
dt = Open( "$SAMPLE_DATA/Big Class.jmp" );
win = New Window( "Window Controls",
Line Up Box( N Col( 2 ), Spacing( 3 ),
Panel Box( "Panel Box",
Check Box( {"Check Box 1", "Check Box 2"} ),
Radio Box( {"Radio Box 1", "Radio Box 2"} ),
Combo Box( {"Combo Box"} ),
Button Box( "Button Box" ),
List Box( {"List Box 1", "List Box 2"} )
),
Col List Box( "all" )
)
);
Figure 10.15 Example of Many Interactive Display Elements
// Slider LogNormal
lU = 1;
lS = 2;
win = New Window( "LogNormal Density",
V List Box(
gr = Graph Box( // define the arguments and script for the graph box
Frame Size( 500, 300 ),
X Scale( 0.01, 3 ),
Y Scale( 0, 4 ),
XAxis( Show Major Grid ),
YAxis( Show Major Grid ),
Y Function(
Exp( -(Log( x ) - Log( lU )) ^ 2 / (2 * lS ^ 2) ) / (lS * x *
Sqrt( 2 * Pi() )),
x
);
Text( {1, .5}, "u= ", lU, " s= ", lS );
// display the specified text at 1 on the x axis
// and .5 on the y axis
),
H List Box( Slider Box( 0, 4, lU, gr << Reshow ), Text Box( "mu" ) ),
// define the minimum and maximum range
// insert the value of lU and updates the display as the slider moves
H List Box(
Slider Box( 0, 4, lS, gr << Reshow ),
Text Box( "sigma" )
),
Button Box( "Reshow", gr << Reshow )
)
);
Show( gr );
gr << Reshow; // update the display of the Graph Box
Figure 10.16 Example of Sliders and Buttons in a Report Window
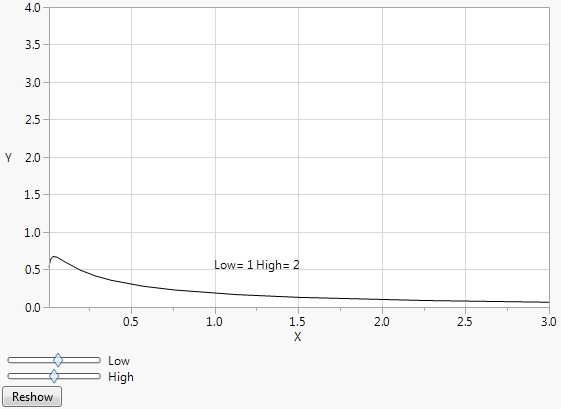
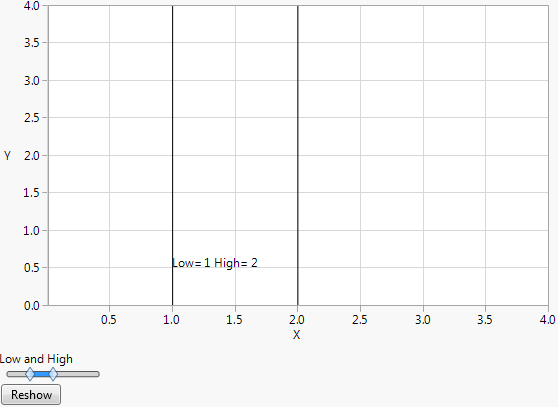
The following script uses a Range Slider Box() instead of a Slider Box() to perform the same function:
lLow = 1;
lHigh = 2;
win = New Window( "Range Slider",
V List Box(
gr = Graph Box(
Frame Size( 500, 300 ),
X Scale( 0.01, 4 ),
Y Scale( 0, 4 ),
XAxis( "Show Major Grid" ),
YAxis( "Show Major Grid" ),
X Function( lLow, x );
X Function( lHigh, x );
Text( {1, .5}, "Low= ", lLow, " High= ", lHigh );
),
V List Box(
Text Box( "Low and High" ),
sb = Range Slider Box( 0, 4, lLow, lHigh, gr << Reshow )
)
),
Button Box( "Reshow",
lLow = 1;
lHigh = 2;
gr << Reshow;
sb << Reshow;
)
);
Show( gr );
gr << Reshow;
Figure 10.17 Example of Using Range Slider Box
The script below is similar but uses Global Box() as an editable text box instead of two Slider Box() controls:
// Global LogNormal
lU = 1;
lS = 2;
win = New Window( "LogNormal Density",
V List Box(
gr = Graph Box( // define the arguments and script for the Graph Box
Frame Size( 500, 300 ),
X Scale( 0.01, 3 ),
Y Scale( 0, 4 ),
XAxis( "Show Major Grid" ),
YAxis( "Show Major Grid" ),
Y Function(
Exp( -(Log( x ) - Log( lU )) ^ 2 / (2 * lS ^ 2) ) / (lS * x *
Sqrt( 2 * Pi() )),
x
);
Text( {1, 1}, "u= ", lU, " s= ", lS, " or type new values below" );
// display the specified text at 1 on the x and y axes
),
H List Box( Global Box( lU ) ),
// display the lU variable value in the first H List Box
H List Box( Global Box( lS ) )
// display the lS variable value in the second H List Box
)
);
Figure 10.18 Example of Using a Global Box Instead of Sliders
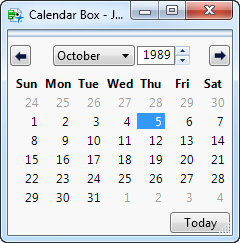
With Calendar Box(), you can select dates from a calendar and input the year. The following example creates a calendar with October 5, 1989 initially selected. You can select any date 60 days before or 60 days after October 5, 1989.
win = New Window( "Calendar Box", cal = Calendar Box() );
date = Date MDY( 10, 5, 1989 );
cal << Date( date );
cal << Show Time( 0 ); // omit the time
cal << Min Date( Date Increment(date, "Day", -60, "start" ) );
// earliest date that can be selected is 60 days before 10/5/1989
// "start" truncates the value so the time is not included
cal << Max Date( Date Increment(date, "Day", 60, "start" ) );
// latest date that can be selected is 60 days after 10/5/1989
cal << Set Function( Function( {this}, Print( Abbrev Date(this << Get Date()) ) ) );
// print the abbreviated date to the log
Figure 10.19 Creating a Calendar
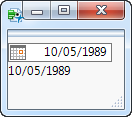
With Number Edit Box(), you can enter a date in the box or click the calendar button to select the date from a calendar.
The following example shows how to create an interactive calendar using Number Edit Box(). The user enters a date in the box or clicks the calendar to select a date from the calendar. The number appears in a text box below the number edit box. “10/05/1989” is initially selected.
f = Function( {this}, // callback
textbox << Set Text( Format( this << Get, "m/d/y" ) ) // get the date
);
win = New Window( "Date Selector",
numbox = Number Edit Box( 0, 20, << Set Function( f ) ),
textbox = Text Box( "" ) // specified date
);
numbox << Set Format(
Format( "m/d/y", 12 )
// date format and number of characters displayed
);
numbox << Set( Date MDY( 10, 5, 1989 ) ); // default date
Figure 10.20 Creating a Date Selector
Note that a callback is assigned to the f variable. In the callback, this refers to the number edit box, the box that calls the function later. Referring to this prevents the need for using the numbox variable within the callback. The Get message is sent to the this argument to get the specified date.
The following example uses the Summarize() function to collect summary statistics on the Height column of Big Class.jmp and then uses display box constructors to show the results in a nicely formatted window.
dt = Open( "$SAMPLE_DATA/Big Class.jmp" );
Summarize(
a = by( age ),
c = count,
sumHt = Sum( Height ),
meanHt = Mean( Height ),
minHt = Min( Height ),
maxHt = Max( Height )
);
win = New Window( "Summary Results",
Table Box(
String Col Box( "Age", a ),
Number Col Box( "Count", c ),
Number Col Box( "Sum", sumHt ),
Number Col Box( "Mean", meanHt ),
Number Col Box( "Min", minHt ),
Number Col Box( "Max", maxHt )
)
);
Figure 10.21 Producing a Customized Summary Report
Show Properties( win );
win << Save Presentation( "$DOCUMENTS/Summary.pptx" );