|
1.
|
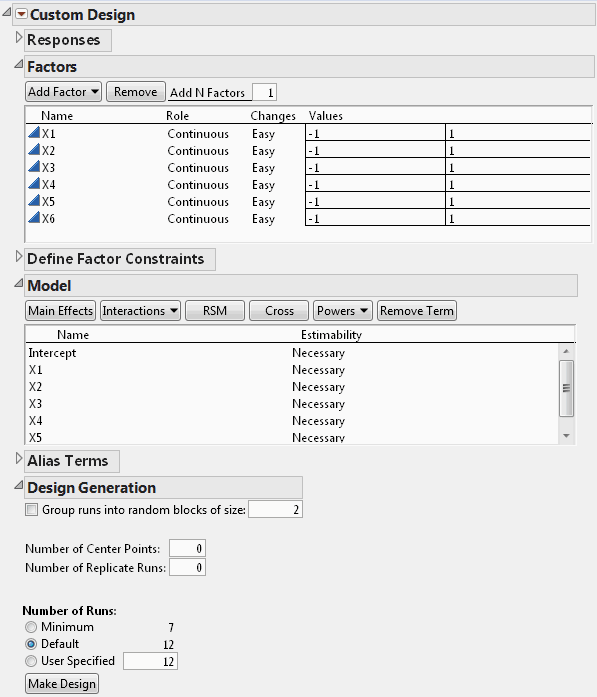
Select DOE > Custom Design.
|
|
2.
|
In the Factors outline, type 6 next to Add N Factors.
|
|
3.
|
Click Add Factor > Continuous.
|
|
4.
|
Click Continue.
|
Figure 4.2 Custom Design Window Showing Model Outline
Note: Setting the Random Seed in step 5 and Number of Starts in step 6 reproduces the exact results shown in this example. When constructing a design on your own, these steps are not necessary.
|
5.
|
(Optional) From the Custom Design red triangle menu, select Set Random Seed, type 1839634787, and click OK.
|
|
6.
|
|
7.
|
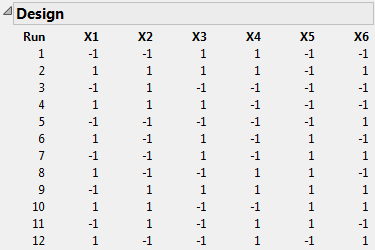
Click Make Design.
|
Figure 4.3 Design for Main Effects Only
|
8.
|
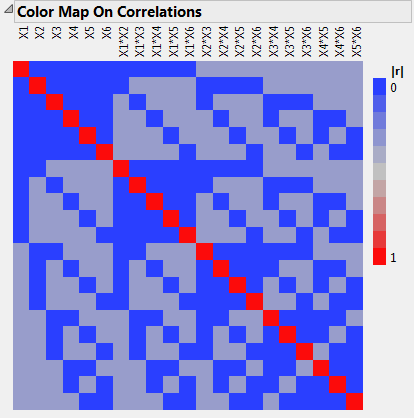
Open the Design Evaluation > Color Map on Correlations outline.
|
Figure 4.4 Color Map on Correlations
|
9.
|
Open the Design Evaluation > Alias Matrix outline.
|
Figure 4.5 Alias Matrix
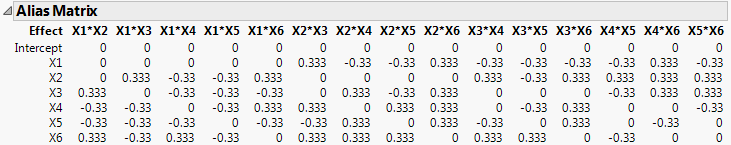
The Alias Matrix shows how the coefficients of the main effect terms in the model are biased by potentially active two-factor interaction effects. The column labels identify interactions. For example, in the X1 row, the column X2*X3 has a value of 0.333 and the column X2*X4 has a value of -0.33. This means that the expected value of the main effect of X1 is the sum of the main effect of X1 plus 0.333 times the effect of X2*X3, plus -0.33 times the effect of X2*X4, and so on, for the rest of the X1 row. In order for the estimate of the main effect of X1 to be meaningful, you must assume that these interactions are negligible in size compared to the effect of X1.