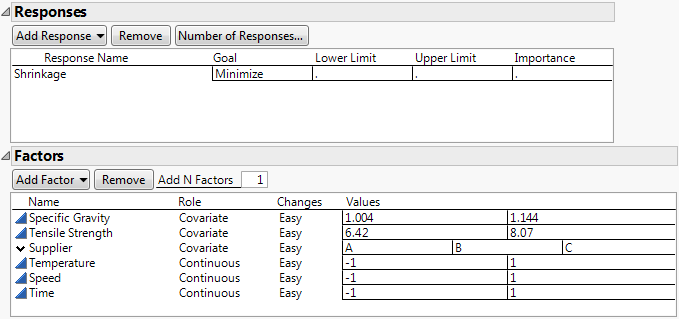
In this example, you are interested in modeling the Shrinkage of parts produced by an injection molding process. The Thermoplastic.jmp sample data table in the Design Experiment folder lists 25 batches of raw (thermoplastic) material for potential use in your study. For each batch, material was removed to obtain measurements of Specific Gravity and Tensile Strength. A third covariate, Supplier, is also available.
You want to study the effects of three controllable factors, Temperature (mold temperature), Speed (screw speed), and Time (hold time), on Shrinkage. But you also want to study the effects of the covariates: Specific Gravity, Tensile Strength, and Supplier. Your resources allow for 12 runs.
|
1.
|
|
2.
|
Select DOE > Custom Design.
|
|
3.
|
|
4.
|
|
5.
|
|
6.
|
|
7.
|
Type 3 next to Add N Factors.
|
|
8.
|
Click Add Factor > Continuous.
|
|
9.
|
Figure 4.62 Responses and Factors Outlines
|
10.
|
Click Continue.
|
|
11.
|
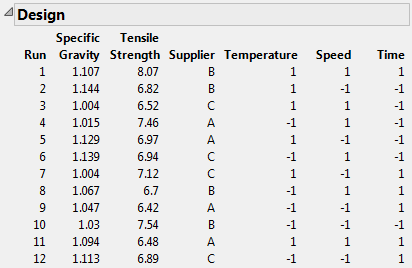
Type 12 next to Number of Runs.
|
Note: Setting the Random Seed in step 12 and Number of Starts in step 13 reproduces the exact results shown in this example. In constructing a design on your own, these steps are not necessary.
|
12.
|
(Optional) From the Custom Design red triangle menu, select Set Random Seed, type 84951, and click OK.
|
|
13.
|
(Optional) From the Custom Design red triangle menu, select Number of Starts, type 40, and click OK.
|
|
14.
|
Click Make Design.
|
Figure 4.63 Twelve-Run Optimal Design
|
1.
|
Open the Design Evaluation > Color Map On Correlations outline.
|
Figure 4.64 Color Map on Correlations
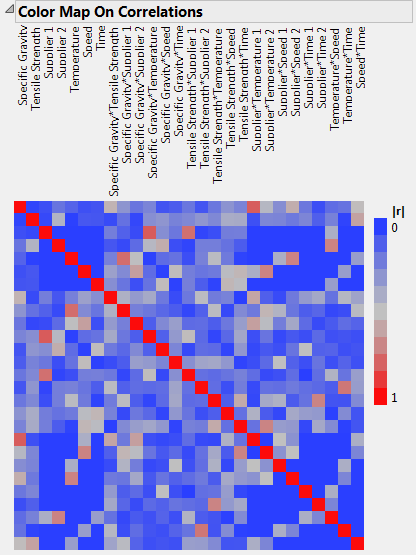
The seven terms corresponding to main effects appear in the upper left corner of the color map. Notice that these seven terms are close to orthogonal. The largest absolute correlation is between Tensile Strength and Supplier 2. This absolute correlation of about 0.43 is a consequence of the available covariate values. (Figure 4.64 uses JMP default colors.)