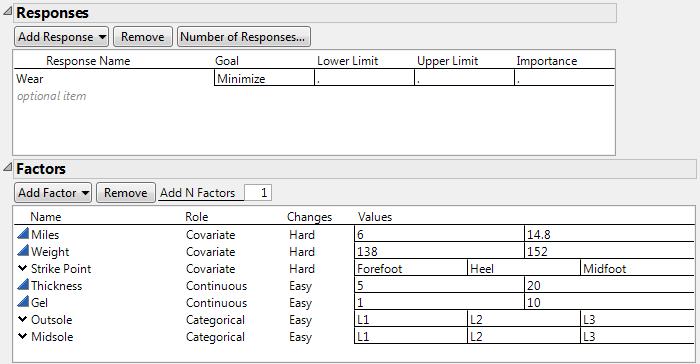
In this example, you construct a design for developing a running shoe for serious runners that has good wear (Wear) properties. Your experimental factors include the following:
|
•
|
sole thickness (Thickness)
|
|
•
|
outsole material (Outsole)
|
|
•
|
midsole material (Midsole)
|
Your company has collected data on 100 suitable runners willing to participate in your study. The concomitant variables (covariates) measured on these runners are average daily miles run (Miles), weight (Weight), and the foot’s strike point (Strike Point).
|
1.
|
|
2.
|
Select DOE > Custom Design.
|
|
3.
|
|
4.
|
|
5.
|
|
6.
|
|
7.
|
For one of the factors Miles, Weight, and Strike Point, under Changes, click Easy and change it to Hard.
|
Note that Changes for all three covariates turnchange to Hard.
To add the remaining factors manually, follow step 8 through step 16. Or, to load factors from a saved table, select Load Factors from the red triangle menu next to Custom Design. Open the Runners Factors.jmp sample data table, located in the Design Experiment folder. If you select Load Factors, skip step 8 through step 16.
|
8.
|
Type 2 next to Add N Factors.
|
|
9.
|
Click Add Factor > Continuous.
|
|
10.
|
|
11.
|
|
12.
|
|
13.
|
Type 2 next to Add N Factors.
|
|
14.
|
Click Add Factor > Categorical > 3 Level.
|
|
15.
|
Keep the default Values for these factors.
Figure 4.65 Responses and Factors Outlines
|
16.
|
Click Continue.
|
|
17.
|
Select Interactions > 2nd.
|
Note: Setting the Random Seed in step 20 and Number of Starts in step 21 reproduces the exact results shown in this example. In constructing a design on your own, these steps are not necessary.
|
20.
|
(Optional) From the Custom Design red triangle menu, select Set Random Seed, type 12345, and click OK.
|
|
21.
|
(Optional) From the Custom Design red triangle menu, select Number of Starts and set it to 1(if it is not already set to that number). Click OK.
|
|
22.
|
Click Make Design.
|
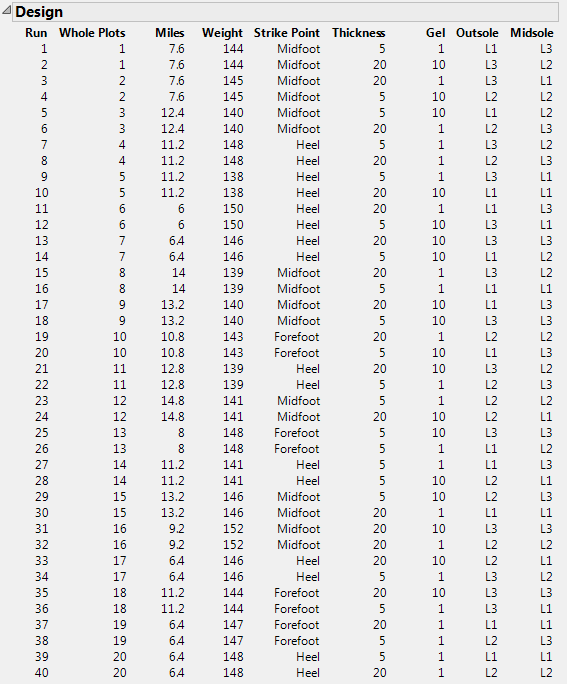
Of the 100 runners, 32 are selected based on their covariate values. The rows corresponding to the selected runners are selected in the RunnersCovariates.jmp sample data table. Settings of the experimental factors Thickness, Gel, Insole, and Outsole are determined so that the design is optimal for the model described in the Model Outline.
|
23.
|
With the RunnersCovariates.jmp sample data table as the active table, select Analyze > Distribution.
|
|
24.
|
Select all three columns as Y, Columns.
|
|
25.
|
Check Histograms Only.
|
|
26.
|
Click OK.
|
