|
1.
|
Select Help > Sample Data, click Open the Sample Scripts Directory, and select Compare Three Run Sizes.jsl.
|
|
2.
|
Right-click in the script window and select Run Script.
|
You want to compare these three designs. Notice that the 16-Run Design table is active.
|
3.
|
|
4.
|
|
5.
|
Click OK.
|
Figure 15.8 Power Analysis Comparison
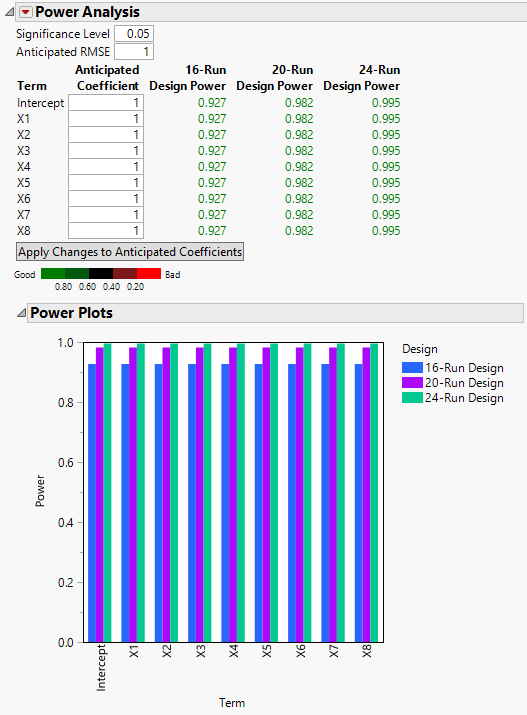
Figure 15.9 Fraction of Design Space Comparison
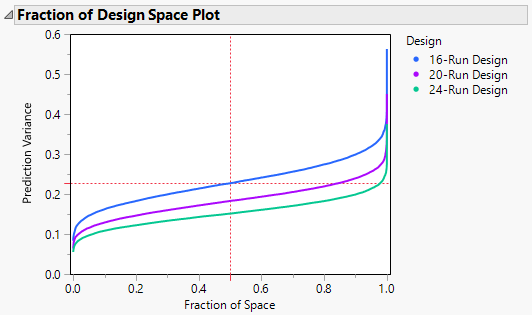
Figure 15.10 Color Map on Correlations Comparison
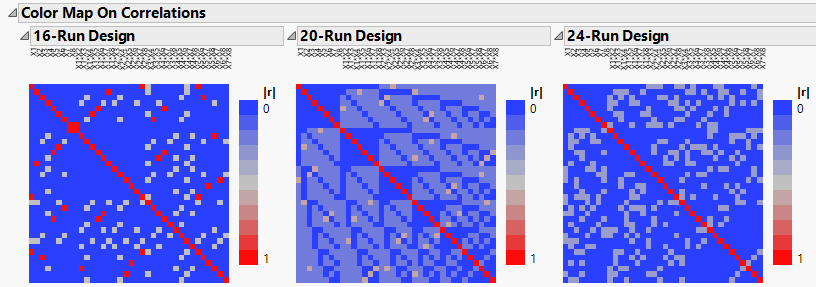
Figure 15.11 Absolute Correlations Comparison
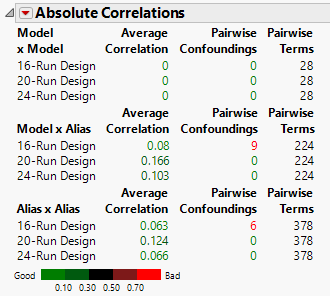
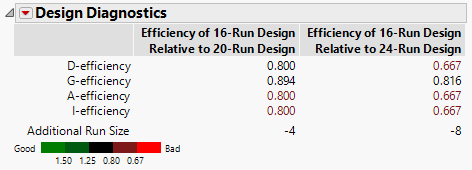
Figure 15.12 Design Diagnostics Comparison
|
7.
|
|
8.
|
In the Model outline, select Interactions > 2nd.
|
|
9.
|
Click OK.
|
The other two effects, X1*X3 and X2*X3, are added to the Compare Design report. You can examine the report to compare the designs if the two interactions are active.