|
1.
|
Select Help > Sample Data, click Open the Sample Scripts Directory, and select Compare Same Run Size.jsl.
|
|
2.
|
Right-click in the script window and select Run Script.
|
|
3.
|
In the Plackett-Burman data table, select DOE > Design Diagnostics > Compare Designs.
|
|
4.
|
|
5.
|
|
6.
|
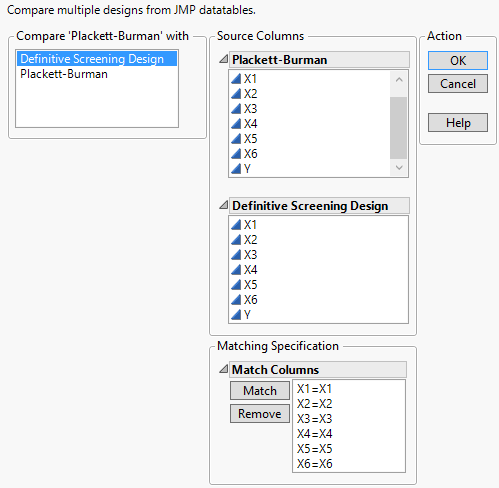
Figure 15.2 Launch Window with Matched Columns
|
7.
|
Click OK.
|
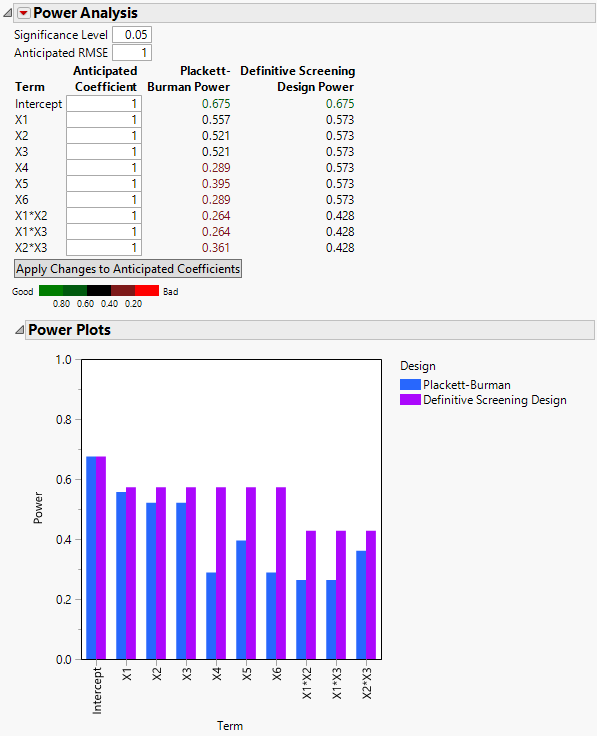
Figure 15.3 Power Analysis for PB and DSD Comparison
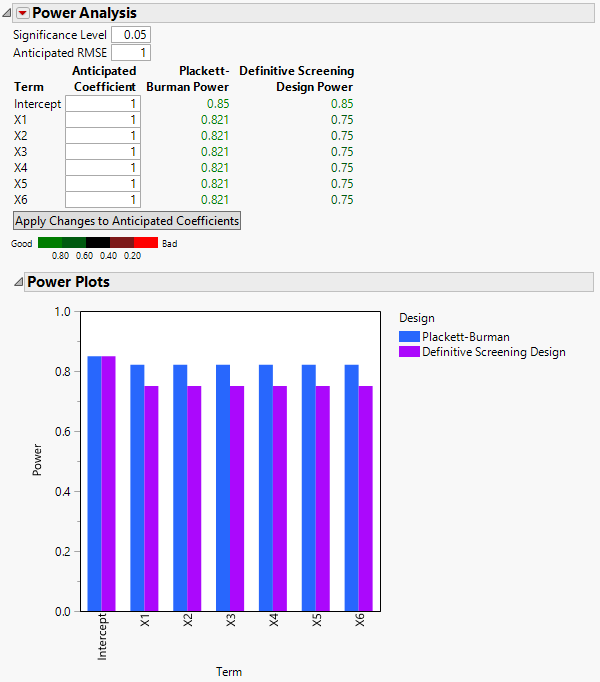
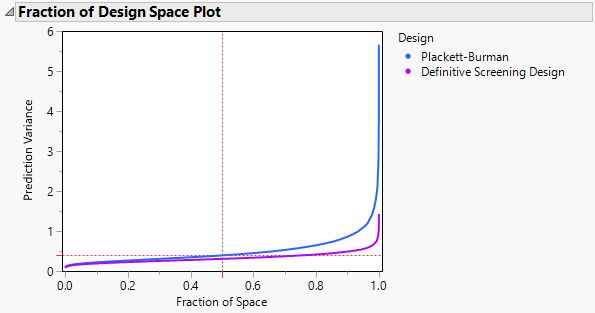
In terms of power, prediction variance, and estimation efficiency, the PB design outperforms the DSD. Figure 15.3 shows the Power Analysis report with the default settings for the significance level, Anticipated RMSE, and coefficients. For tests for the main effects, the PB design has higher power than does the DSD.
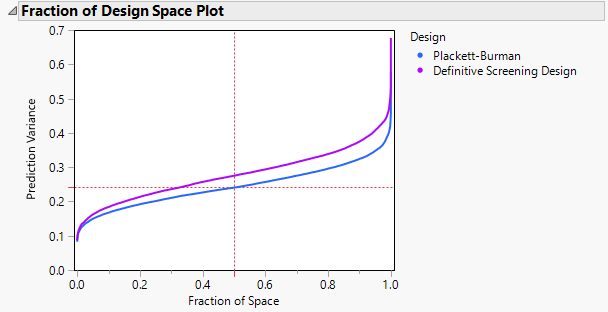
Figure 15.5 Color Maps for PB and DSD Comparison
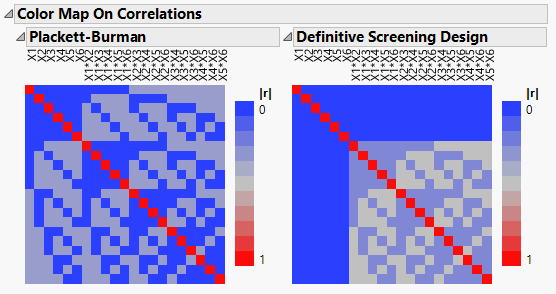
The Color Map on Correlations plots in Figure 15.5 show that the PB design aliases main effects with two-way interactions. In contrast, the DSD does not alias main effects with two-way interactions.
|
2.
|
|
3.
|
In the Model outline, select Interactions > 2nd.
|