|
1.
|
|
2.
|
Select Analyze > Fit Y by X.
|
|
3.
|
|
4.
|
|
5.
|
Click OK.
|
|
6.
|
From the red triangle menu, select each one of the Compare Means options. For the With Control, Dunnett’s option, select age 17 as the control group.
|
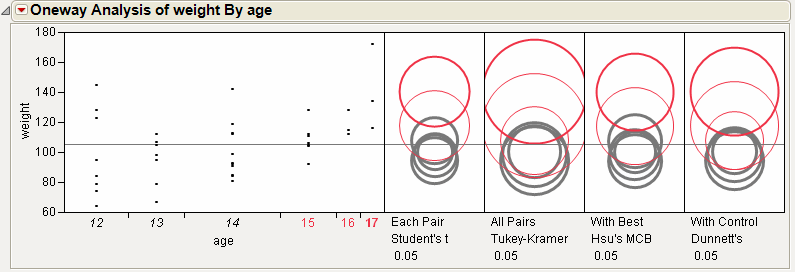
From Figure 5.72, notice that for the Student’s t and Hsu methods, age group 15 (the third circle from the top) is significantly different from the control group and appears gray. But, for the Tukey and Dunnett method, age group 15 is not significantly different, and appears red.