|
•
|
A set of n columns, where n is also the number of rows. These n columns define a symmetric matrix with zero or missing values on the diagonal.
|
Notice that the distance matrix in Flight Distances.jmp follows the preceding format.
|
1.
|
|
2.
|
Select Analyze > Clustering > Hierarchical Cluster.
|
|
3.
|
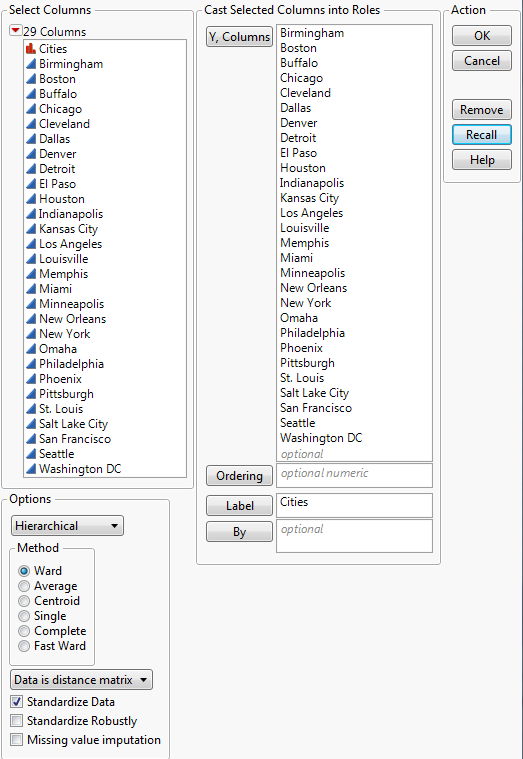
In the list at the bottom left corner of the launch window, change Data as usual to Data is distance matrix.
|
|
4.
|
|
5.
|
Select all remaining columns and click Y, Columns.
|
Figure 10.6 Completed Distance Matrix Launch Window
|
6.
|
Click OK.
|
|
7.
|
Figure 10.7 Dendrogram Report for Flight Distances
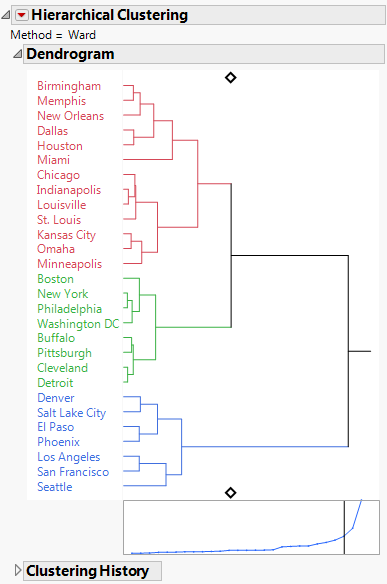
Figure 10.7 shows the Dendrogram report for the flight distances. The placement of the diamonds indicates that the model has grouped the cities into three clusters, which are color-coded on the dendrogram. For more details about how to interpret the report, see Dendrogram Report.