The following example is an experiment described by Byrne and Taguchi (1986). The objective of the experiment is to find settings of control factors to maximize the adhesiveness (pull-off force) of nylon tubing. Four control factors are evaluated across three noise factors.
|
1.
|
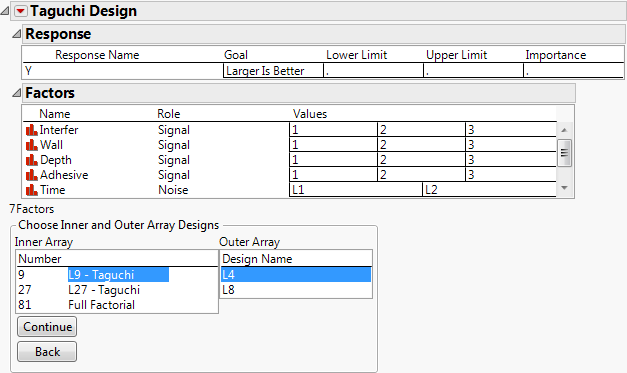
Select DOE > Classical > Taguchi Arrays.
|
|
2.
|
|
4.
|
Ensure that L9-Taguchi is selected for the inner array.
|
|
5.
|
Click L8 for the outer array design.
|
Figure 13.2 Completed Taguchi Design Window
|
6.
|
Click Continue.
|
|
7.
|
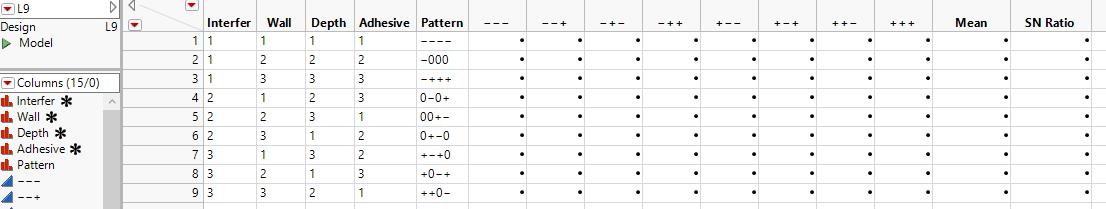
Figure 13.3 Taguchi Design before Data Entry
|
8.
|
Select Help > Sample Data Library and open Design Experiment/Byrne Taguchi Data.jmp. Figure 13.4 shows the completed design.
|
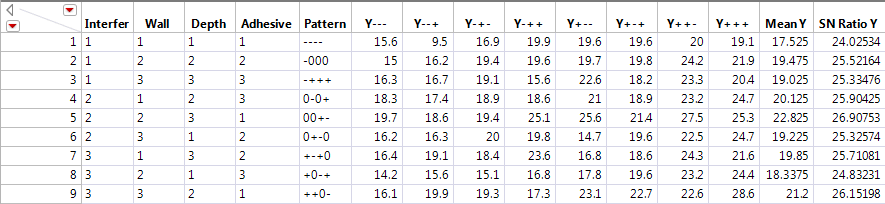
The SN Ratio Y column is the performance statistic (larger is better) to maximize the response. It is computed as –10 times the common logarithm of the average of the squared reciprocals of the responses:
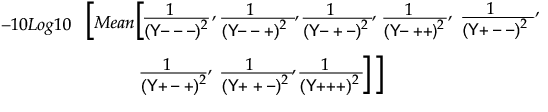
This expression is large when all of the individual y response values are large. That is, you are trying to find the signal settings that result in the largest response across the noise settings.
|
1.
|
In the Byrne Taguchi Data.jmp data table, click the green arrow to run the Model script.
|
Figure 13.5 Fit Model Launch Window for Taguchi Data
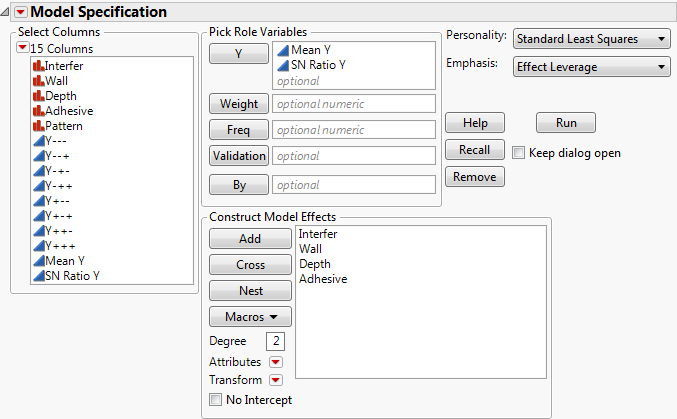
The script launches the Fit Model window. The model includes the main effects of the four signal factors to model the mean (Mean Y) and signal-to-noise ratio (SN Ratio Y) responses.
|
2.
|
Click Run.
|
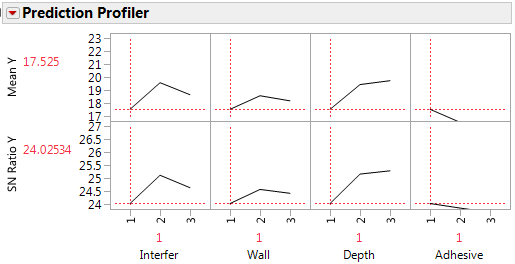
Figure 13.6 The Prediction Profiler
|
3.
|
From the Prediction Profiler red triangle menu, select Optimization and Desirability > Desirability Functions.
|
This adds a row of traces and a column of function settings to the profiler, as shown in Figure 13.7. The default desirability functions are set to larger-is-better, which is what you want in this experiment. See Profiler in the Profilers book for more details about desirability functions in the prediction profiler.
|
4.
|
From the Prediction Profiler red triangle menu, select Optimization and Desirability > Maximize Desirability.
|
Figure 13.7 Best Factor Settings for Byrne Taguchi Data
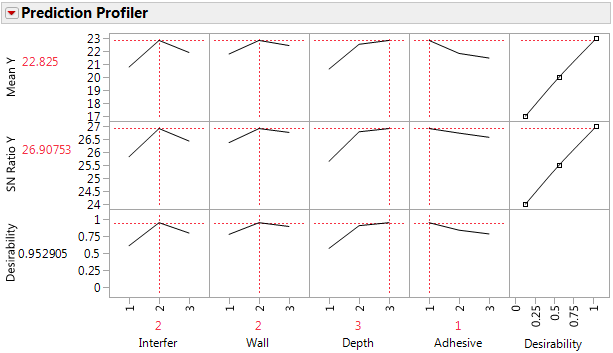
In this example, the optimal settings for Interfer and Wall are 2, Depth is 3, and Adhesive is 1. These settings result in a predicted Mean value of 22.8 and an SN Ratio of 26.9.