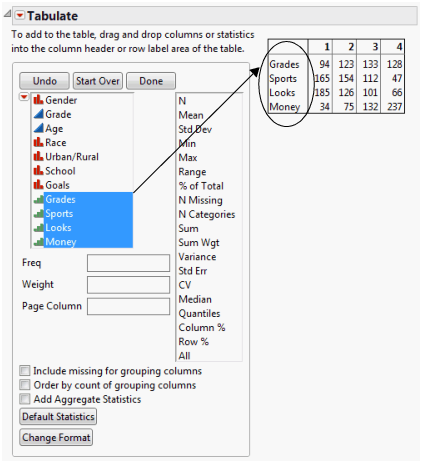
You have data from students indicating the importance of self-reported factors in children’s popularity (grades, sports, looks, money). Suppose that you want to see all of these factors in a single, combined table with additional statistics and factors. You want the table to look like Figure 8.144.
Figure 8.144 Adding Demographic Data
|
1.
|
|
2.
|
Select Analyze > Tabulate.
|
|
3.
|
Figure 8.145 Columns by Categories
|
4.
|
Drag Gender into the empty heading at left.
|
|
5.
|
Drag % of Total above the numbered headings.
|
|
6.
|
Drag All beside the number 4.
|
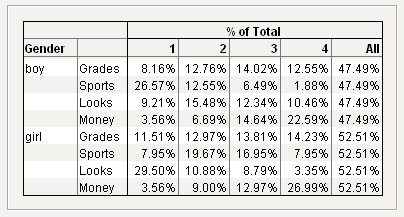
Figure 8.146 Gender, % of Total, and All Added to the Table
|
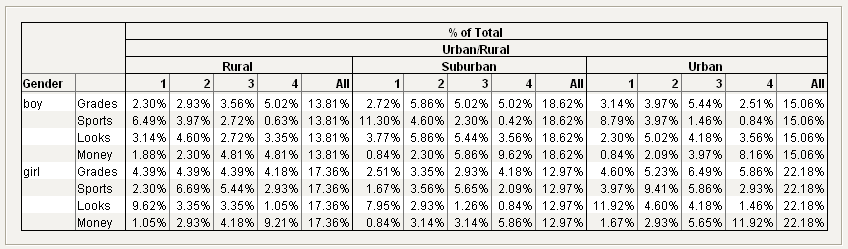
7.
|
Figure 8.147 Urban/Rural Added to the Table