Suppose that you would like to create a table that contains counts for how many people in a survey own Japanese, European, and American cars, broken down by the size of the car. You want the table to look Figure 8.128.
Figure 8.138 Table Showing Counts of Car Ownership
|
1.
|
|
2.
|
Select Analyze > Tabulate.
|
|
3.
|
Click country and drag it into the Drop zone for rows.
|
|
4.
|
Figure 8.139 Country and Size Added to the Table
Suppose that you would like to see the mean (average) and the standard deviation of the age of people who own each size of car. You want the table to look like Figure 8.140.
Figure 8.140 Table Showing Mean and Standard Deviation by Age
|
1.
|
|
2.
|
Click Mean and drag it over Sum.
|
|
3.
|
Click Std Dev and drag it below Mean.
|
Figure 8.141 Age, Mean, and Std Dev Added to the Table
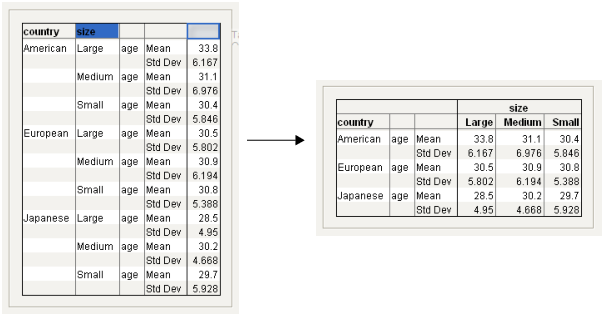
Suppose that you would prefer size to be on top, showing a crosstab layout. You want the table to look like Figure 8.142.
Figure 8.142 Size on Top
|
1.
|
Start from Figure 8.141. Click on the size heading and drag it to the right of the table headings. See Figure 8.143.
|
Figure 8.143 Moving size
|
2.
|
Click on age and drag it under the Large Medium Small heading.
|
|
3.
|
Select both Mean and Std Dev, and then drag them under the Large heading.
|