This example uses the Consumer Preferences.jmp sample data table, which contains survey data on people’s attitudes and opinions, as well as questions concerning oral hygiene. You explore the distribution of the responses to the statement “I am working on my career” between employee tenure groups.
|
1.
|
|
2.
|
|
3.
|
|
4.
|
|
5.
|
Click OK.
|
|
6.
|
Click the Categorical red triangle menu and select Compare Each Cell.
|
Figure 4.12 Compare Each Cell
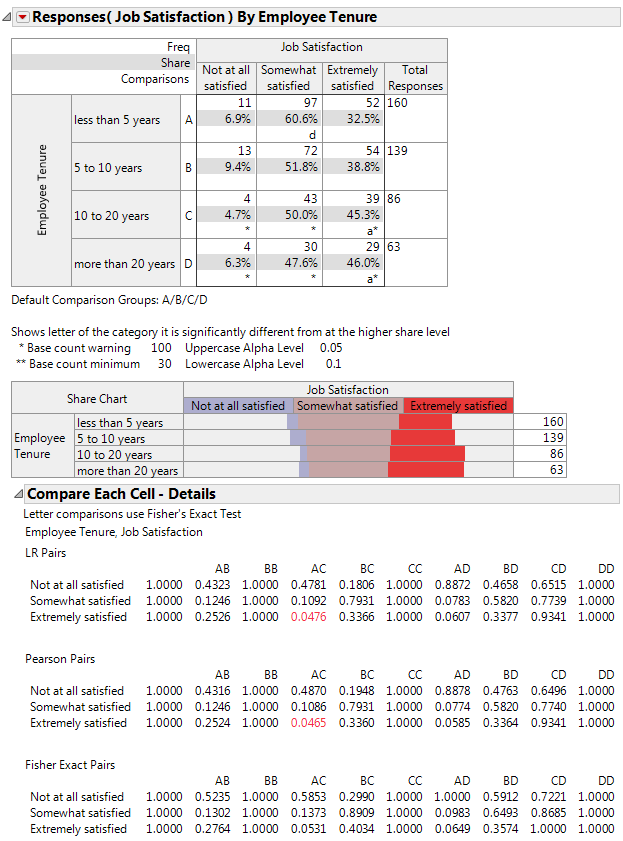
The p-values for pairwise Pearson Chi-square, likelihood ratio chi-square, and Fisher’s exact tests for independence are provided in tables. The tables are labeled by comparison letters. The comparison letters are shown in the Crosstab table to the right of the group labels. Response rates that differ by groups are indicated with a comparison letter in the Crosstab table cells.