In a study of rabbits who were given penicillin, you want to know what dose of penicillin results in a 0.5 probability of curing a rabbit. In this case, the inverse prediction for 0.5 is called the ED50, the effective dose corresponding to a 50% survival rate. Use the crosshair tool to visually approximate an inverse prediction.
|
1.
|
|
2.
|
Select Analyze > Fit Y by X.
|
|
3.
|
|
4.
|
Notice that JMP automatically fills in Count for Freq. Count was previously assigned the role of Freq.
|
5.
|
Click OK.
|
|
7.
|
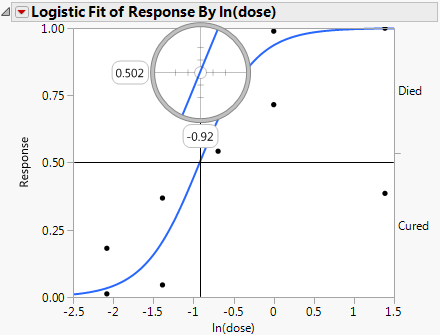
Place the horizontal crosshair line at about 0.5 on the vertical (Response) probability axis.
|
|
8.
|
Move the cross-hair intersection to the prediction line, and read the In(dose) value that shows on the horizontal axis.
|
In this example, a rabbit with a In (dose) of approximately -0.9 is equally likely to be cured as it is to die.
Figure 7.123 Example of Crosshair Tool on Logistic Plot