This example uses the Analgesics.jmp sample data table. Thirty-three participants were administered three different types of analgesics (A, B, and C). The participants were asked to rate their pain levels on a sliding scale. You want to find out if the means for A, B, and C are significantly different.
|
1.
|
|
2.
|
Select Analyze > Fit Y by X.
|
|
3.
|
|
4.
|
|
5.
|
Click OK.
|
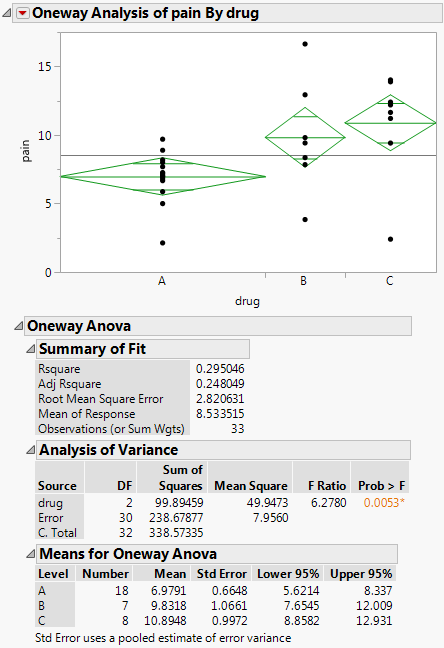
Figure 5.51 Example of Oneway Analysis
You notice that one drug (A) has consistently lower scores than the other drugs. You also notice that the x-axis ticks are unequally spaced. The length between the ticks is proportional to the number of scores (observations) for each drug.
|
6.
|
Note: If the X factor has only two levels, the Means/Anova option appears as Means/Anova/Pooled t, and adds a Pooled t-test report to the report window.
Figure 5.52 Example of the Means/Anova Option
|
–
|
|
•
|
The Analysis of Variance report shows the standard ANOVA information. You notice that the Prob > F (the p-value) is 0.0053, which supports your visual conclusion that there are significant differences between the drugs.
|