|
1.
|
|
2.
|
Select Graph > Legacy > Chart.
|
|
3.
|
|
4.
|
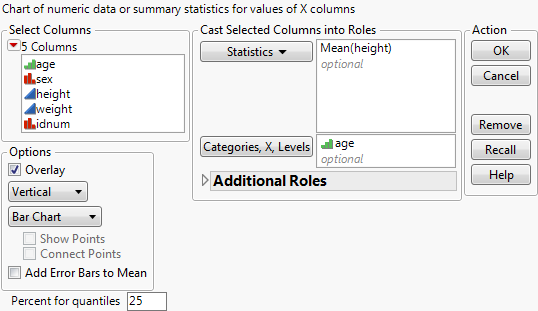
Select Mean from the menu of statistics.
|
|
5.
|
Figure 13.2 The Completed Chart Launch Window
|
6.
|
Click OK.
|
Figure 13.3 Mean of height by age
|
7.
|
From the red triangle menu for Chart, select Redo > Relaunch Analysis.
|
The Chart launch window appears, already filled out for you. If you clicked OK now, you would see a duplicate of the chart you already have.
|
9.
|
|
10.
|
Click OK.
|
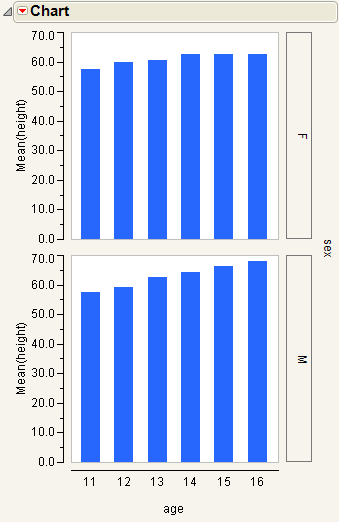
Figure 13.4 Mean of height by age and Grouped by sex