|
1.
|
|
2.
|
Select Analyze > Fit Y by X.
|
|
3.
|
|
4.
|
|
5.
|
Click OK.
|
|
6.
|
From the red triangle menu, select Compare Means > With Control, Dunnett’s.
|
Alternatively, click on a row to highlight it in the scatterplot before selecting the Compare Means > With Control, Dunnett’s option. The test uses the selected row as the control group.
|
8.
|
Click OK.
|
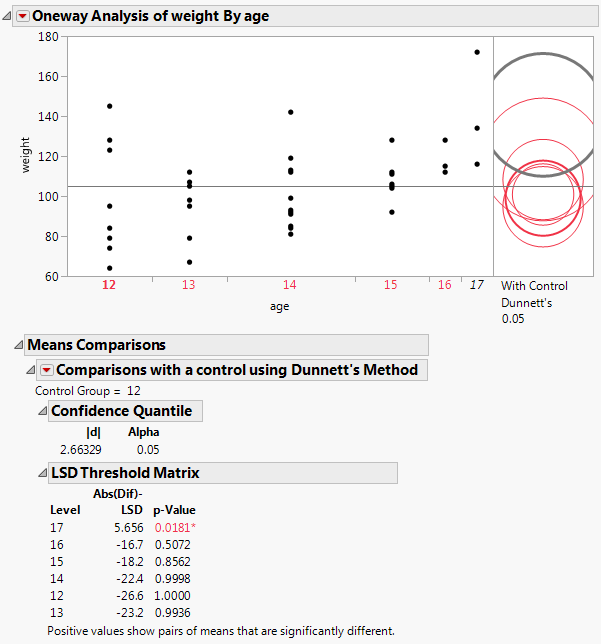
Using the comparison circles in Figure 5.70, you can conclude that level 17 is the only level that is significantly different from the control level of 12.