|
1.
|
|
2.
|
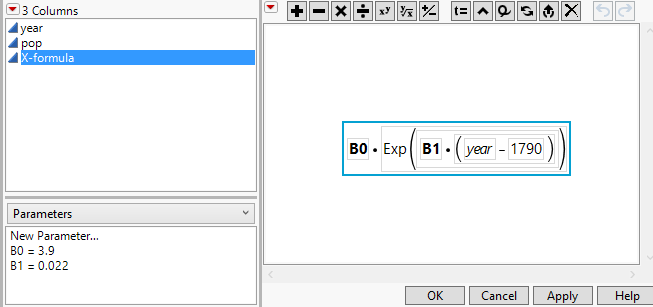
Figure 3.40 Formula for Nonlinear Fit to Population
|
3.
|
Click Cancel.
|
|
4.
|
Select Graph > Graph Builder.
|
|
5.
|
|
6.
|
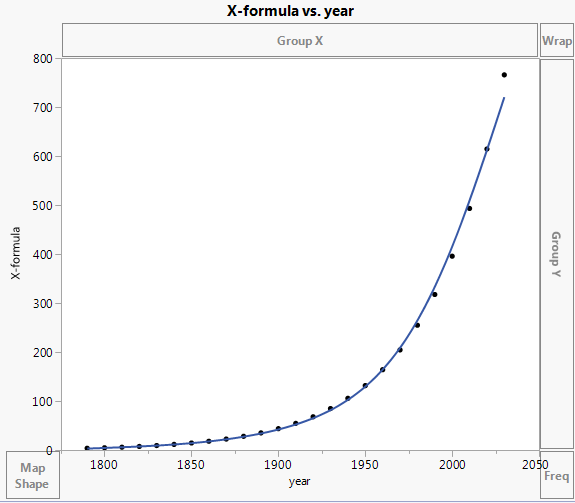
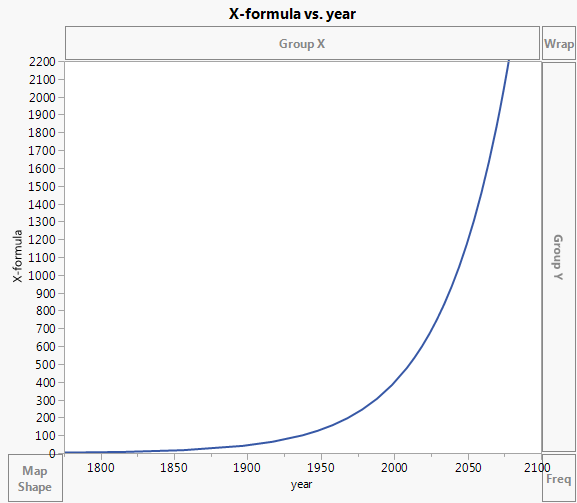
Points are plotted for the years up to 2030. The points are the values of the function, X-formula, evaluated at the years in the year column. The function can be evaluated at the years for which pop is missing: 2010, 2020, and 2030. The smoother that is shown is only an approximation to the function. You want to see the function itself.
 .
.
Figure 3.42 Graph of Function
|
9.
|
|
11.
|
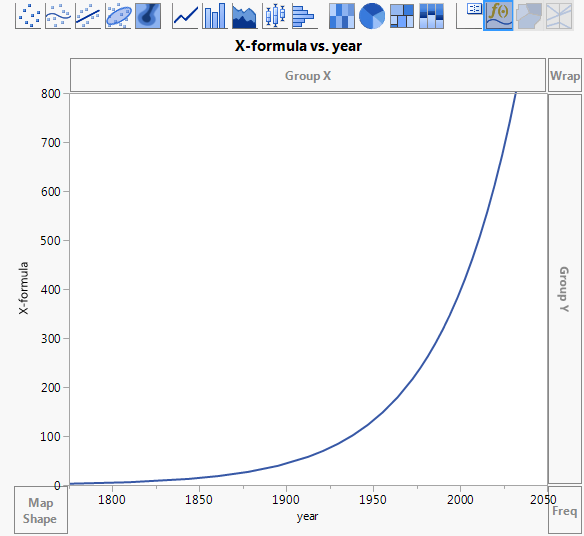
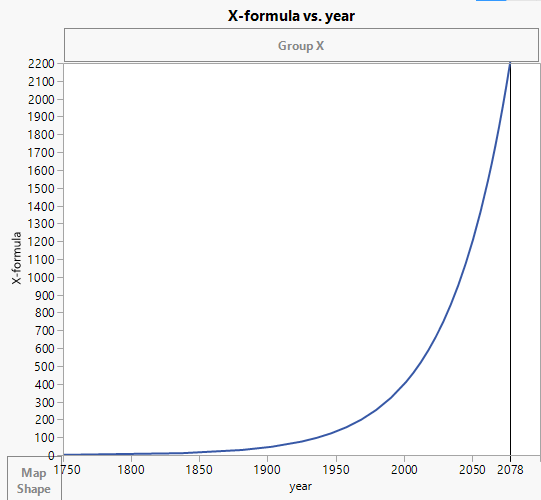
Figure 3.43 Graph of Function to Year 2100
|
13.
|
|
14.
|
Click Add.
|
|
15.
|
Click OK.
|
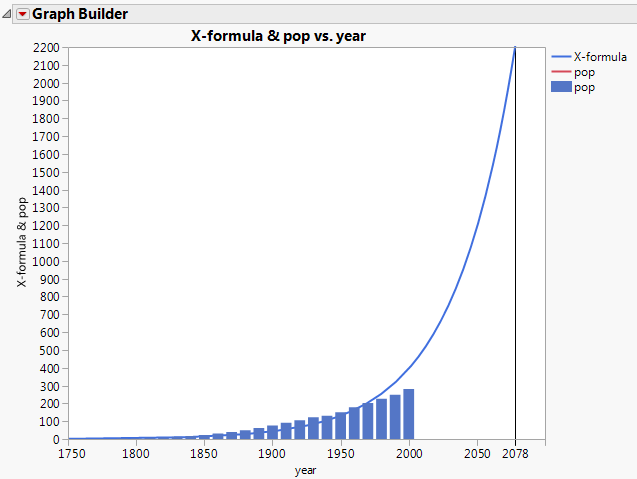
Figure 3.44 Projected US Population at Year 2078
|
16.
|
Figure 3.45 Merging pop with X-formula in the Y Zone
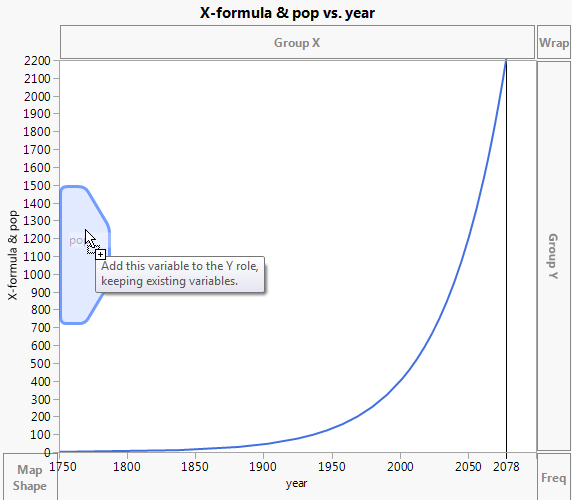
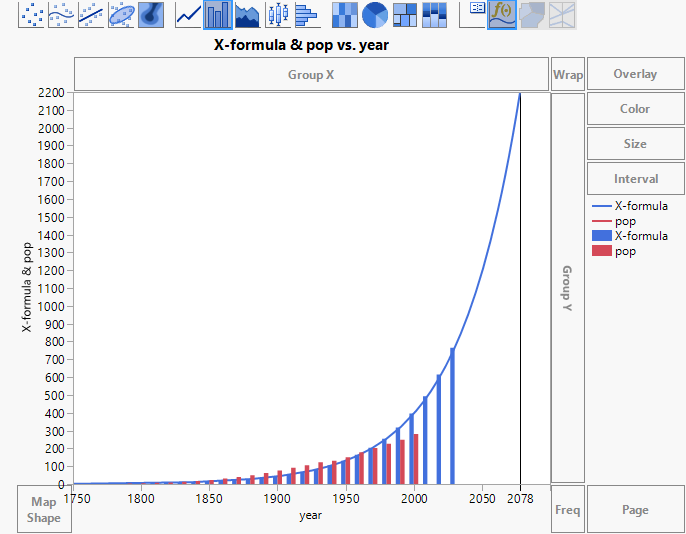
Figure 3.46 Bars Showing Values for pop and X-formula
|
18.
|
|
19.
|
(Optional) Click Done.
|