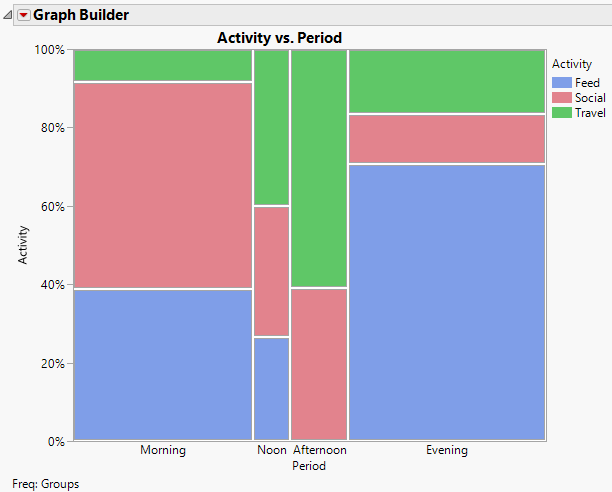
In this example, you are interested in whether there is a relationship between the time of day and the activity of dolphins. Your data consist of Activity and Period (time of day) combinations, and the numbers of Groups of dolphins observed for each combination. Notice that Groups is a frequency column.
|
1.
|
|
2.
|
Select Graph > Graph Builder.
|
|
3.
|
|
4.
|
|
5.
|
|
7.
|
(Optional) Click Done.
|
Figure 3.39 Mosaic Plot for Dolphin Activity