|
1.
|
|
2.
|
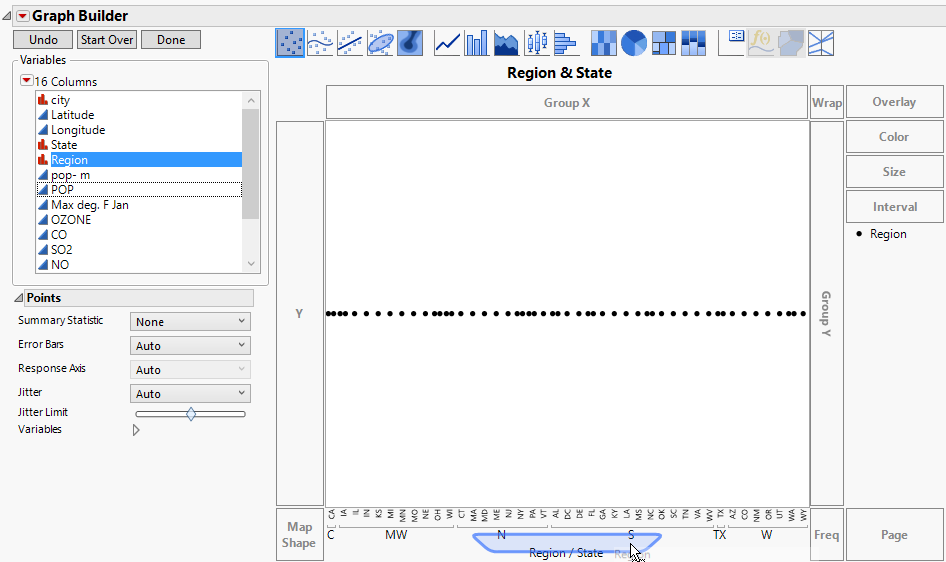
Select Graph > Graph Builder.
|
|
3.
|
|
4.
|
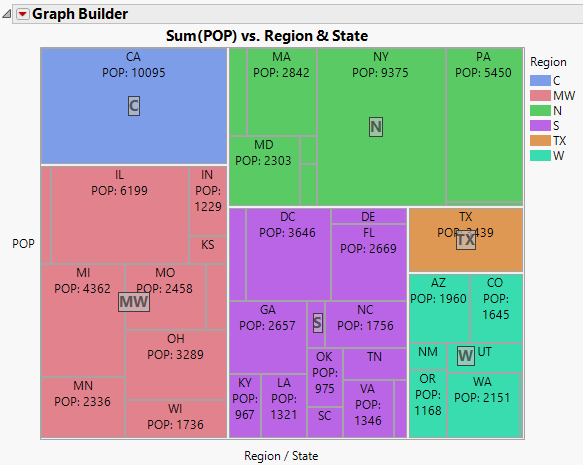
Figure 3.37 Region Merged with State
|
5.
|
|
7.
|
|
8.
|
Under the Treemap options, check the box next to Size Value.
|
|
9.
|
(Optional) Click Done.
|
Figure 3.38 City Populations by State Grouped within Region