|
1.
|
|
2.
|
|
3.
|
|
4.
|
|
5.
|
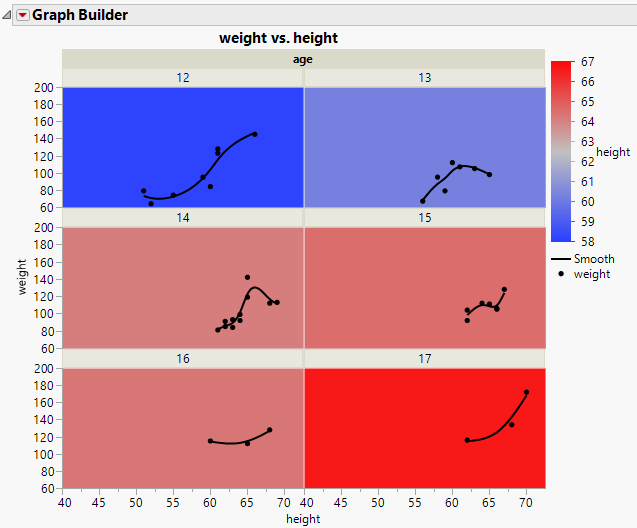
Figure 3.33 Graph of height and weight Colored by height
 into the plot.
 into the plot.
|
9.
|
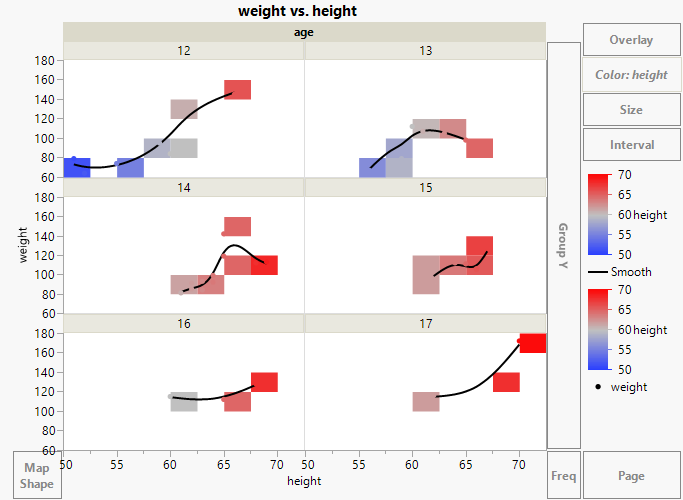
Figure 3.34 Heatmap, Smoother, and Points, Wrapped by age
|
10.
|
|
11.
|
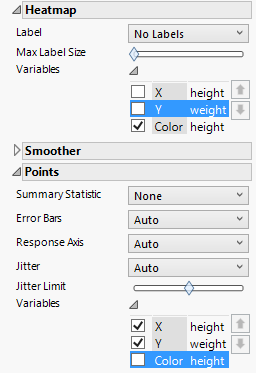
Figure 3.35 Variables Options
13. (Optional) Click Done.