Figure 15.25 Fraction of Design Space Plot for Three Designs
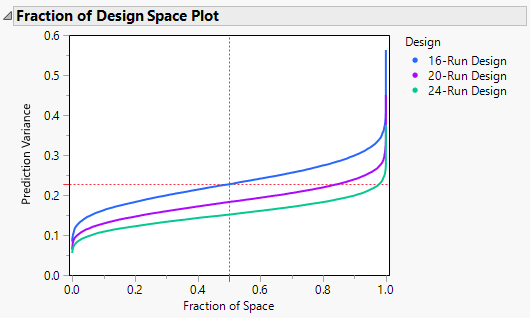
Figure 15.25 shows the Fraction of Design Space plot for the three designs constructed in Designs of Different Run Sizes. Note the following:
|
•
|
The X axis in the plot represents the proportion of the design space, ranging from 0 to 100%.
|
|
•
|
The Y axis represents relative prediction variance values.
|
|
•
|
For a point (x, y) that falls on a given curve, the value x is the proportion of design space with variance less than or equal to y.
|
Figure 15.25 shows that the relative prediction variance for the 24-run design is uniformly smaller than for the other two designs. The 20-run design has uniformly smaller prediction variance than the 16-run design. The red dotted crosshairs indicate that the relative prediction variance for the 20-run design is less than about 0.23 over about 50% of the design space.