The Fraction of Design Space Plot shows the proportion of the design space over which the relative prediction variance lies below a given value. It is desirable to have a large proportion of the design space with low prediction variance values. Figure 14.20 shows the Fraction of Design Space plot for the Bounce Data.jmp sample data table, located in the Design Experiment folder.
Figure 14.20 Fraction of Design Space Plot
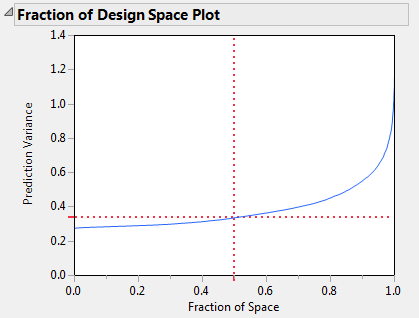
The X axis in the plot represents the proportion of the design space, ranging from 0 to 100%. The Y axis represents relative prediction variance values. For a point (x, y) that falls on the blue curve, the value x is the proportion of design space with variance less than or equal to y. Red dotted crosshairs mark the value that bounds the relative prediction variance for 50% of design space.
Figure 14.20 shows that the minimum relative prediction variance is slightly less than 0.3, while the maximum is below 1.4. (The actual maximum is 1.395833, as shown in Figure 14.19.) The red dotted crosshairs indicate that the relative prediction variance is less than 0.34 over about 50% of the design space. You can use the crosshairs tool to find the maximum relative prediction variance that corresponds to any Fraction of Space value. Use the crosshairs tool in Figure 14.20 to see that 90% of the prediction variance values are below approximately 0.55.