The Prediction Variance Profile helps you to understand where in the design space your predictions have more or less variability. Low prediction variance is desired. Use the Maximize Variance option to find the maximum variance. For details, see Maximize Variance.
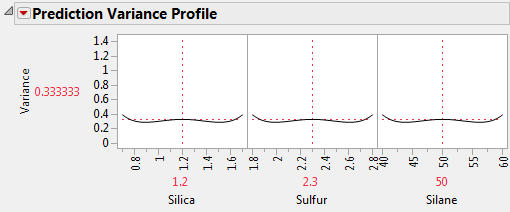
The Prediction Variance Profile plots the relative variance of prediction as a function of each factor at fixed values of the other factors. Figure 14.18 shows the Prediction Variance Profile for the Bounce Data.jmp data table, located in the Design Experiment folder.
Figure 14.18 Prediction Variance Profiler
For given settings of the factors, the prediction variance is the product of the error variance and a quantity that depends on the design and the factor settings. Before you run your experiment, the error variance is unknown, so the prediction variance is also unknown. However, the ratio of the prediction variance to the error variance is not a function of the error variance. This ratio, called the relative prediction variance, depends only on the design and the factor settings. Consequently, the relative variance of prediction can be calculated before acquiring the data. For details, see Relative Prediction Variance in Technical Details.
You can evaluate a design or compare designs in terms of the maximum relative prediction variance. Select the Maximize Variance option from the red triangle menu next to Prediction Variance Profile. JMP uses a desirability function that maximizes the relative prediction variance. The value of the maximum variance in the Prediction Variance Profile is the worst (least desirable from a design point of view) value of the relative prediction variance. The maximum variance can occur at more than one combination of factor settings.
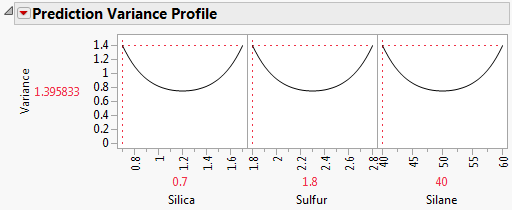
Figure 14.19 shows the Prediction Variance Profile with Maximize Variance selected. The plot is for the Bounce Data.jmp sample data table, located in the Design Experiment folder. The maximum value of the relative prediction variance is 1.3958 when Silica = 0.7, Sulfur = 1.8, and Silane = 40. However, keep in mind that several factor settings can have this same relative variance. The design point with Silica = 1.6, Sulfur = 2.8, and Silane = 60 also has relative prediction variance of 1.3958. To evaluate the prediction variance using a surface, see Prediction Variance Surface.
Figure 14.19 Prediction Variance Profile Showing Maximum Variance