Overlay Plot normally assumes you want a function plot when the Y column contains a formula. However, formulas that contain random number functions are more frequently used with simulations, where function plotting is not often wanted. Therefore, the Function Plot option is off by default when a random number function is present, but on for all other functions.
|
1.
|
|
2.
|
|
3.
|
|
4.
|
|
5.
|
Click OK.
|
|
6.
|
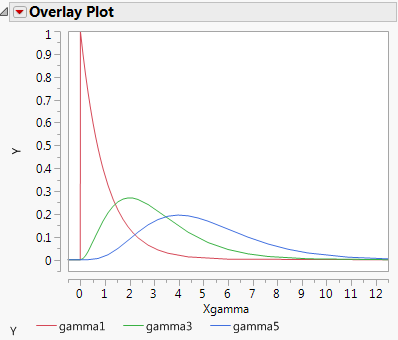
Figure 4.8 Function Plot