|
1.
|
|
2.
|
|
3.
|
|
4.
|
|
5.
|
Click OK.
|
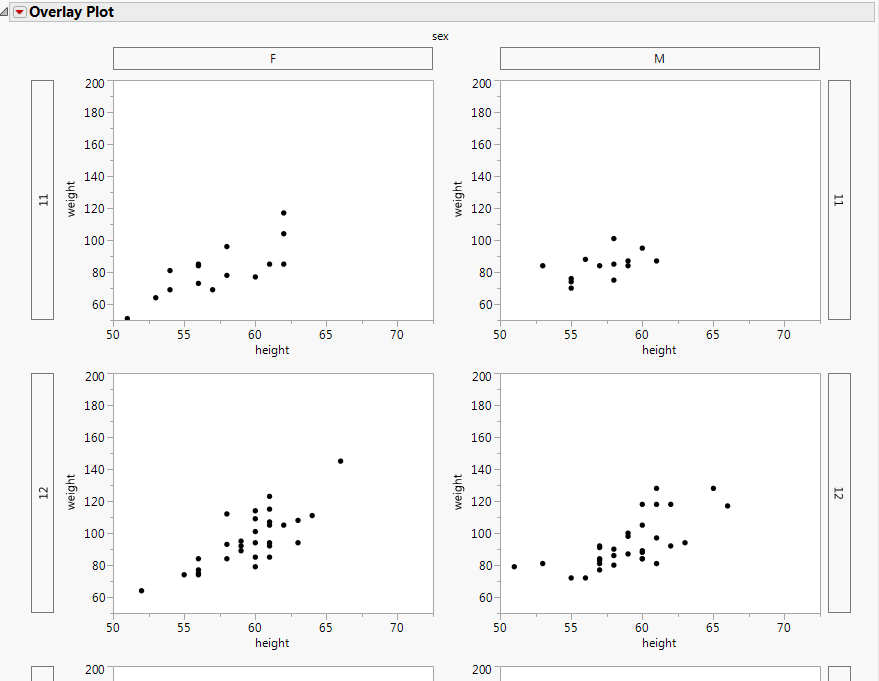
Figure 4.11 Grouped Plots Without Separate Axes
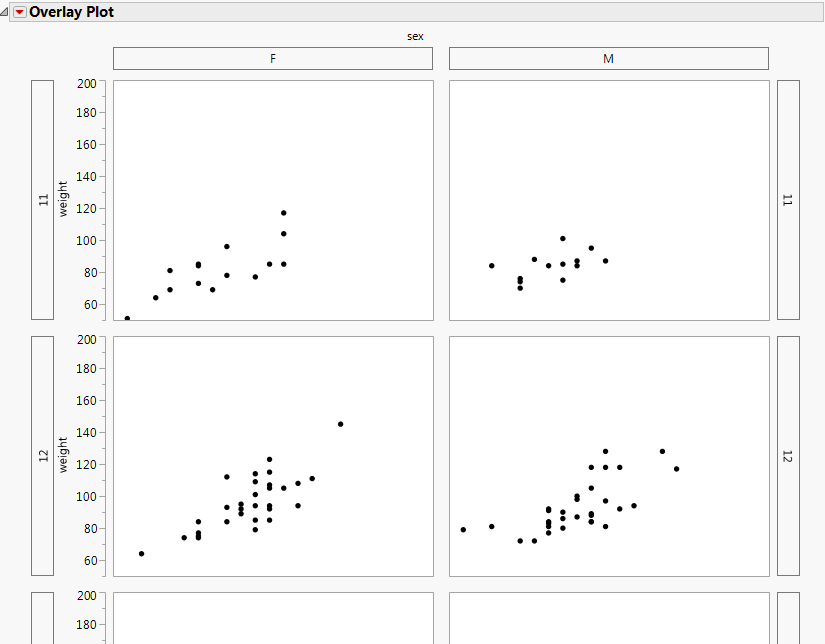
Select the Separate Axes option from the red triangle menu to produce plots that do not share axes. Compare Figure 4.11 to Figure 4.12.
Figure 4.12 Grouping Variables