As you drag these handles, the changing response value shows in the area labeled Desirability to the left of the plots. The dotted line is the response for the current factor settings. The overall desirability shows to the left of the row of desirability traces. Alternatively, you can select Optimization and Desirability > Set Desirabilities to enter specific values for the points.
Figure 2.10 shows steps to create desirability settings.
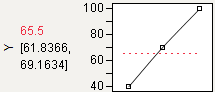
The default desirability function setting is maximize (“higher is better”). The High control point is positioned at the maximum Y value and aligned at the high desirability, close to 1. The Low control point is positioned at the minimum Y value and aligned at a low desirability, close to 0.
Figure 2.10 Maximizing Desirability
You can designate a target value as “best.” In this example, the middle control point is positioned at Y = 70 and aligned with the maximum desirability of 1. Y becomes less desirable as its value approaches either 40 or 100. The High and Low control points at Y = 40 and Y = 100 are positioned at the minimum desirability close to 0.
Figure 2.11 Defining a Target Desirability
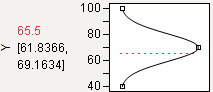
Figure 2.12 Minimizing Desirability
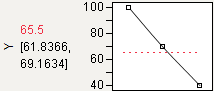
Note: Dragging the High or Low control point of a maximize or minimize desirability function across the y-value of the middle point results in the opposite point reflecting. A Minimize becomes a Maximize, and vice versa.