Launch Overlay Plot by selecting Graph > Legacy > Overlay Plot.
Figure 4.4 The Overlay Plot Launch Window
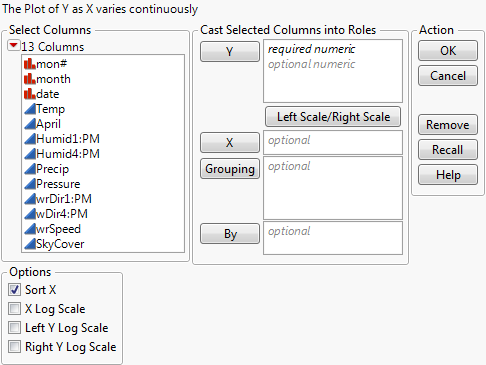
The columns assigned to the Y role have a left- or right-pointing arrow to the left of the column name. This arrow designates on which vertical axis (on the left or right of the plot) the variable appears. Change the designation by highlighting the column in the Y list and clicking the Left Scale/Right Scale button.
This option applies a log scale to the left y-axis. It is available only if one or more Y variables are left-scaled. (See Left Scale/Right Scale.)
This option applies a log scale to the right y-axis. It is available only if one or more Y variables are right-scaled. (See Left Scale/Right Scale.)