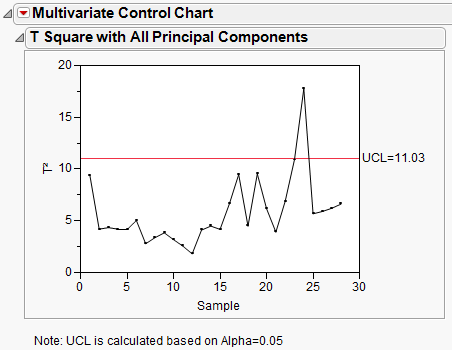
Multivariate control charts are used to monitor two or more interrelated process variables. Where univariate control charts are used to monitor a single independent process characteristic, multivariate control charts are necessary when process variables are correlated. The Multivariate Control Chart platform enables you to build Hotelling T2 charts. You can use the platform to determine whether a process is stable as well as to monitor a process as new data are collected.
Figure 6.1 Example of a Multivariate Control Chart