The Outlier Analysis calculates the Mahalanobis distances from each point to the center of the multivariate normal distribution. This measure relates to contours of the multivariate normal density with respect to the correlation structure. The greater the distance from the center, the higher the probability that it is an outlier. For more information about the Mahalanobis distance and other distance measures, see Multivariate Platform Options in the Multivariate Methods book.
You can save the distances to the data table by selecting the Save option from the Mahalanobis Distances red triangle menu.
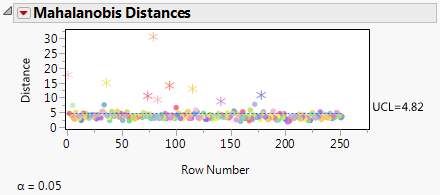
Figure 2.8 shows the Mahalanobis distances of 16 different columns. The plot contains an upper control limit (UCL) of 4.82.This UCL is meant to be a helpful guide to show where potential outliers might be. However, you should use your own discretion to determine which values are outliers. For more details about this upper control limit (UCL), see Mason and Young (2002).