The Outlier Analysis menu contains options that show or hide plots that measure distance in the multivariate sense using one of these methods:
|
•
|
T2 statistic
|
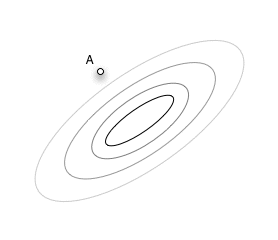
In Figure 2.5, Point A is an outlier because it is outside the correlation structure rather than because it is an outlier in any of the coordinate directions.
Figure 2.5 Example of an Outlier
The Mahalanobis Outlier Distance plot shows the Mahalanobis distance of each point from the multivariate mean (centroid). The standard Mahalanobis distance depends on estimates of the mean, standard deviation, and correlation for the data. The distance is plotted for each observation number. Extreme multivariate outliers can be identified by highlighting the points with the largest distance values. See Mahalanobis Distance Measures for more information.
The Jackknife Distances plot shows distances that are calculated using a jackknife technique. The distance for each observation is calculated with estimates of the mean, standard deviation, and correlation matrix that do not include the observation itself. The jack-knifed distances are useful when there is an outlier. In this case, the Mahalanobis distance is distorted and tends to disguise the outlier or make other points look more outlying than they are. See Jackknife Distance Measures for more information.
T2 Statistic
The T2 plot shows distances that are the square of the Mahalanobis distance. This plot is preferred for multivariate control charts. The plot includes the value of the calculated T2 statistic, as well as its upper control limit. Values that fall outside this limit might be outliers. See T2 Distance Measures for more information.
You can save any of the distances to the data table by selecting the Save option from the red triangle menu for the plot.
Note: There is no formula saved with the jackknife distance column. This means that the distance is not recomputed if you modify the data table. If you add or delete columns, or change values in the data table, select Analyze > Multivariate Methods > Multivariate again to compute new jackknife distances.
