1.
Select Help > Sample Data Library and open Companies.jmp.
2.
Select Graph > Legacy > Chart.
3.
Select Size Co and click Categories, X, Levels.
4.
The bar chart in Figure 13.12 shows a bar for each level of the Size Co variable.
Figure 13.12 Example of a Chart with one Category and no Statistics
1.
Select Help > Sample Data Library and open Companies.jmp.
2.
Select Graph > Legacy > Chart.
3.
Select Type and click Categories, X, Levels.
4.
Select Size Co and click Categories, X, Levels.
5.
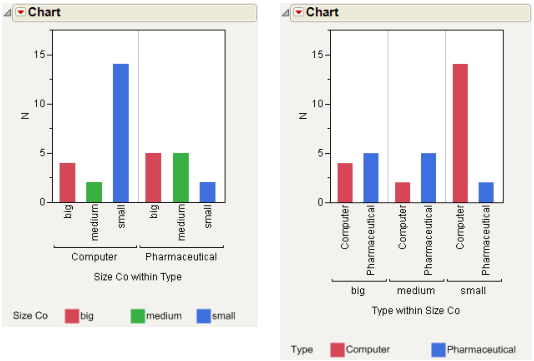
The bar chart on the left in Figure 13.13 shows the levels for the size of computer companies and of pharmaceutical companies. The bar chart on the right shows the results if you first selected Size Co and then Type as category variables.
Figure 13.13 Examples of Charts with Two Categories and No Statistics

Help created on 7/12/2018