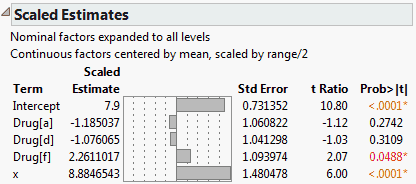
The Effect Screening > Scaled Estimates command on the report’s red triangle menu gives coefficients corresponding to scaled factors. The factors are scaled to have a mean of zero and a range of two. Figure 2.42 shows a report for Drug.jmp.
|
1.
|
|
2.
|
Select Analyze > Fit Model.
|
|
3.
|
|
4.
|
|
5.
|
Change the Emphasis to Minimal Report.
|
|
6.
|
Click Run.
|
|
7.
|
From the red triangle menu next to Response y, select Effect Screening > Scaled Estimates.
|
The report (Figure 2.42) indicates that the continuous factor, x, is centered by its mean and scaled by its half-range.
Figure 2.42 Scaled Estimates Report
The model fits three parallel lines, one for each Drug group. The x values range from 3 to 21. The Scaled Estimate for x, 8.8846543, is half the difference between the predicted value for x = 21 and the predicted value for x = 3 for any one of the Drug groups. You can verify this fact by selecting Save Columns > Prediction Formula from the report’s red triangle menu. Then add rows to obtain predicted values for each of the Drug groups at x = 21 and x = 3.
So, over the range of x values in this particular data set, the impact of x is to vary the response over a range of about 17.8 units. Note that the parameter estimate for x based on the raw data is 0.9871838; it does not permit direct interpretation in terms of the response.
