|
1.
|
|
2.
|
Select Graph > Graph Builder.
|
|
3.
|
|
4.
|
Select Statistical > Col Mean.
|
|
5.
|
In the formula, click height so that the blue box is around only the variable name.
|
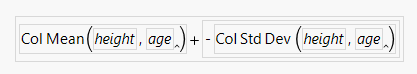
Figure 3.22 Select the height Variable
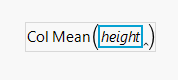
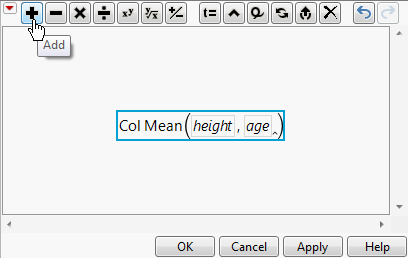
Figure 3.23 Click the Plus Sign
|
8.
|
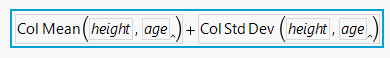
Click Statistical > Col Std Dev.
|
|
9.
|
Click height.
|
Figure 3.24 Formula for Upper Bound
|
12.
|
Click OK.
|
|
13.
|
|
14.
|
|
1.
|
|
2.
|
|
3.
|
Figure 3.25 Selecting Col Std Dev and Making It Negative
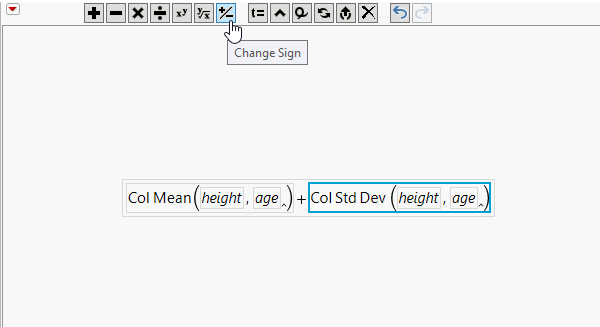
Figure 3.26 Formula for Lower Bound
|
4.
|
Click OK.
|
|
5.
|
|
6.
|
|
1.
|
|
2.
|
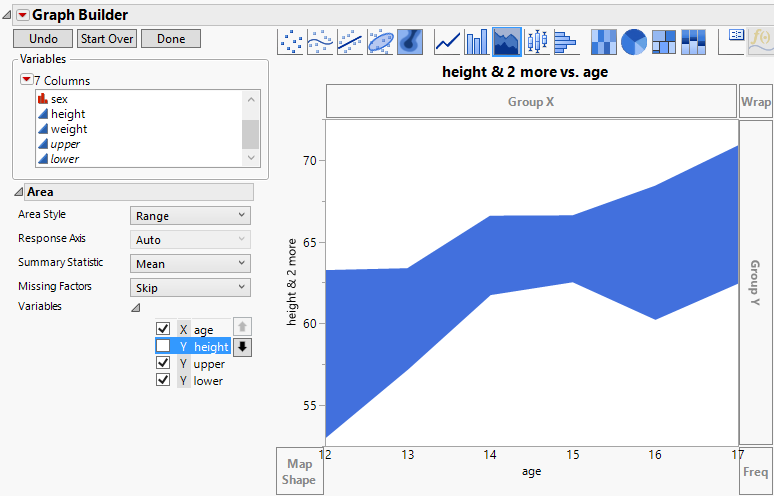
Figure 3.27 Area Plot
|
7.
|
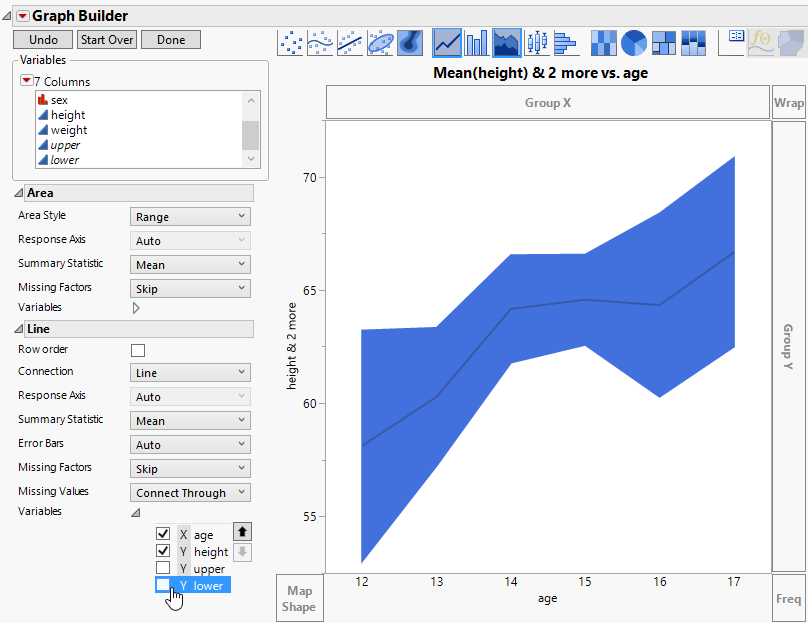
In the Line options, click the triangle next to Variables. De-select Y upper and Y lower. See Figure 3.28.
|
Figure 3.28 Area Plot with Mean Line
|
8.
|
(Optional) Click Done.
|
The dark blue line connects the mean heights for each age group. As expected, height tends to increase as age increases. The shaded area shows a range of one standard deviation above and one standard deviation below the mean height at each age group.