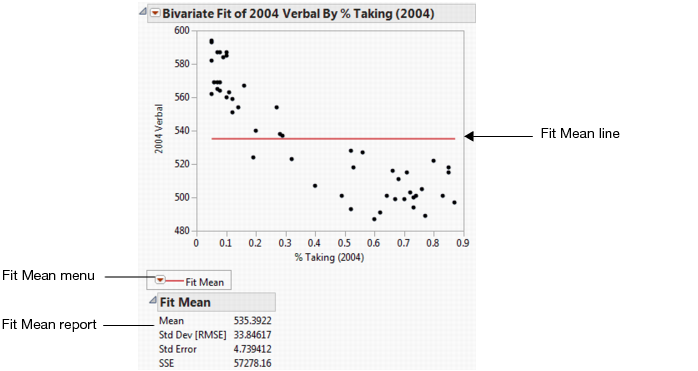
Using the Fit Mean command, you can add a horizontal line to the scatterplot that represents the mean of the Y response variable. You can start by fitting the mean and then use the mean line as a reference for other fits (such as straight lines, confidence curves, polynomial curves, and so on).
|
Error sum of squares for the simple mean model. Appears as the sum of squares for Error in the analysis of variance tables for each model fit.
|