|
•
|
Static mode, where the bubbles are fixed and do not animate over time (no Time variable is specified). See Example of a Static Bubble Plot.
|
|
•
|
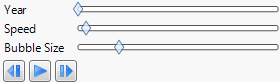
Dynamic mode, where the bubbles are animated over time (a Time variable is specified). See Example of a Dynamic Bubble Plot.
|
|
<Time variable>
|
||
|
|
||
|
|
||
|
|
||
|
Separates the bubble represented by the first, larger ID variable into its smaller constituent parts, which are defined by the second, smaller ID column.
Select the bubble and click Split.
|
Only appears if you have specified two ID variables.
|
|
|
Reverses the action of the Split button by recombining the smaller bubbles back into their original bubble.
|
Only appears if you have specified two ID variables.
|
|
•
|
|
•
|
If the bubble is an aggregate based on an ID column, all of the rows for that ID are highlighted. Otherwise, the one row represented by that bubble is highlighted.
|
|
•
|
If you specify an ID and a Time variable, selecting a bubble highlights all of the rows for that ID, across all of the Time levels.
|
|
•
|
If you have not specified a Time variable, selecting one row from the data table highlights the corresponding bubble in the plot.
|
|
•
|
If you have specified a Time variable, selecting one row from the data table highlights the corresponding bubble for only that time period in the dynamic bubble plot.
|
Note: For a more granular examination of the highlighted rows, use the Tables > Subset command or the Row Editor. See the Using JMP book.