Launch the Multivariate platform by selecting Analyze > Multivariate Methods > Multivariate.
|
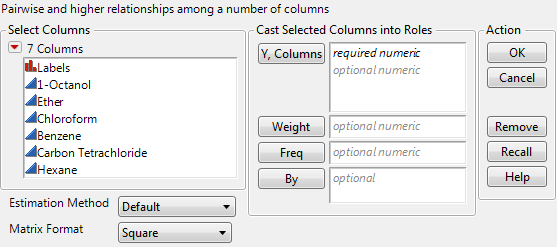
Select from one of several estimation methods for the correlations. With the Default option, Row-wise is used for data tables with no missing values. Pairwise is used for data tables that have more than 10 columns or more than 5000 rows, and that have missing values. Otherwise, the default estimation method is REML. For details, see Estimation Methods.
|
|
|
Select a format option for the Scatterplot Matrix. The Square option displays plots for all ordered combinations of columns. Lower Triangular displays plots on and below the diagonal, with the first n - 1 columns on the horizontal axis. Upper Triangular displays plots on and above the diagonal, with the first n - 1 columns on the vertical axis.
|
Several estimation methods for the correlations options are available to provide flexibility and to accommodate personal preferences. REML and Pairwise are the methods used most frequently. You can also estimate missing values by using the estimated covariance matrix, and then using the Impute Missing Data command. See Impute Missing Data.
The Default option uses either the Row-wise, Pairwise, or REML methods:
|
•
|
Row-wise is used for data tables with no missing values.
|
|
•
|
Pairwise is used in these circumstances:
|
|
•
|
REML is used otherwise.
|