See Constructing Display Trees, after reviewing the introduction of this section.
|
Tip: The Report Invalid Display Box Messages option in the General preferences helps you identify invalid display box messages.
|
|
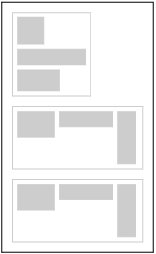
V List Box glues boxes together vertically.
|
|
|
H List Box glues boxes together horizontally.
|
|
|
You can nest V List Boxes and H List Boxes together. Here is a V List Box gluing together a V List Box and two H List Boxes.
|
|
|
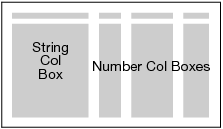
Table Boxes are special H List Boxes whose elements are string and number columns.
|
|
|
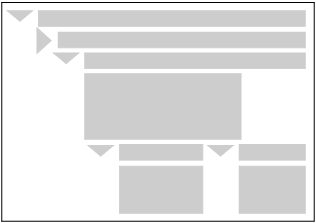
Outline Boxes create an outline hierarchy.
|
|
|
Picture Boxes glue together axes, frames, and labels to make graphs.
|
JSL has some other display box types for custom displays: Button Box, Slider Box, Range Slider Box, Tab Box and Global Box. These are discussed under Interactive Display Elements. In addition, editable text boxes (Text Edit Box) and boxes to make trees similar to those from the Diagram platform (Hier Box) are supported.
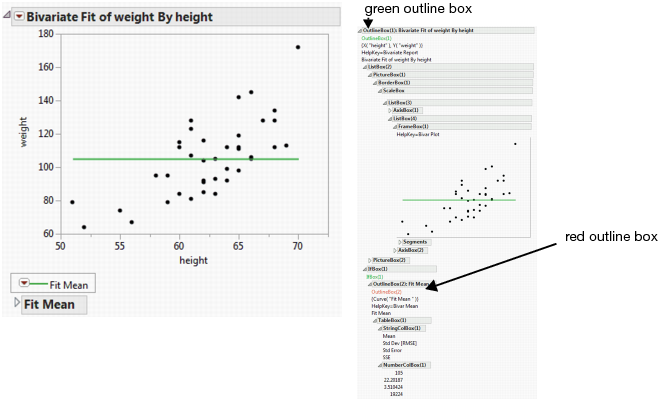
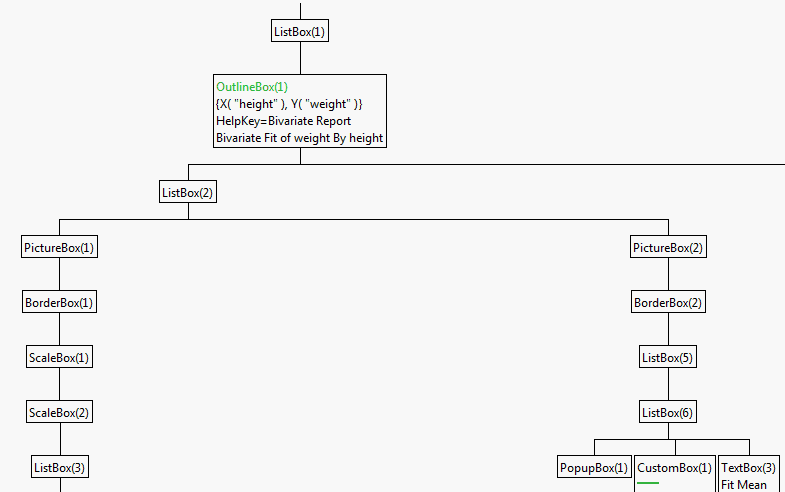
Here is a report from Bivariate for Big Class.jmp, annotated to show the structure of the display boxes.
Display Boxes and Display JSL Functions, describes the box types and how they arrange their contents. Boxes labeled as “leaf” are those that contain no other boxes inside.
|
2.
|
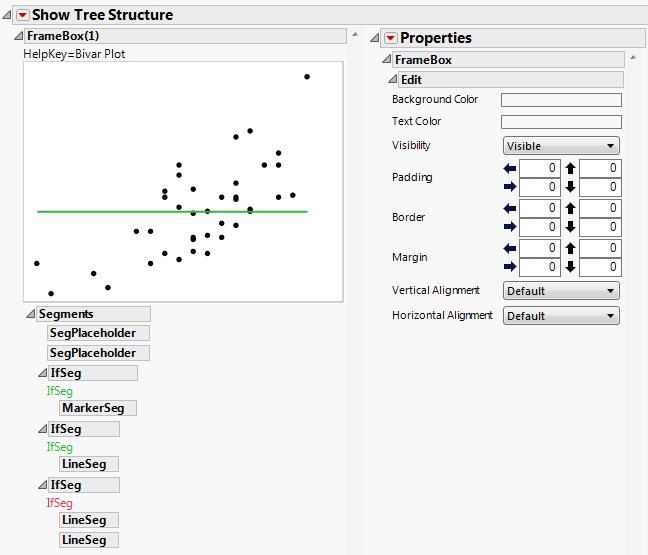
Right-click an empty area of the report, and then select Edit > Show Tree Structure.
|
You can also obtain the tree structure through a script: send the << Show Tree Structure() message to any report. Or, send the message to a piece of the report (any display box object) to see the tree structure for just that part of the report.
You can edit the properties directly from the display tree. From the red triangle next to Show Tree Structure, select Show Properties. Then click on the node that you want to edit. In the example below, the Properties box appears when you click on the plot.
A special type of JSL value called a display box reference can own or reference a Display Box. (Syntax summaries throughout this manual use db as a placeholder for any display box reference, dt for a data table reference, and obj for a scriptable object reference.)
You can create a display box reference with the Report message to access the top of the display tree associated with a scriptable platform.
Note: Do not confuse a reference to a report with a reference to a platform. They are different types of objects and can receive different types of JSL messages. For example, reports can do such things as copy pictures, select display boxes, or close outline nodes. Platforms can do such things as run tests, draw plots, or close entire windows.
If you want to make a reference to another part of the report, the easiest thing to do is use the subscript operator to find it. You can use any of the following methods, which all work by searching for a complete text string. The "text" argument can also be any expression that evaluates to a text string. A subscript reference uses the following format:
The line above finds the display box in db that has the title text and assigns it to the variable var. Note that text must be the complete title, not just a substring of the title.
The line above finds the Outline Box containing the specified text string in the rbiv report and assigns it to the out2 variable.
Tip: To determine the index number of a display box, view the tree structure as described in Nesting and Precedence.
Matches the last argument to a display box that is contained by the penultimate argument’s outline node, which is in turn contained by the antepenultimate argument, and so on. In other words, it is a way of digging down the generations of an outline tree to identify a nested display box.
If you want to identify an item nested several layers down in an outline box, use a subscript with more than one argument of any of the above types. After locating the first item, JMP looks inside that item for the next, and so on.
db[arg1,arg2,arg3] /* finds the first item, then the next starting after that location, and so on */
db[arg1][arg2][arg3] // same as comma version
Note: When numbering Outline Boxes, it does not matter if the outline is closed or not. However, closed If Boxes do cause fragments of the tree to disappear entirely.
You could also use the wildcard character to find a display box by a partial title match as described in Wildcard String.
The display reference can be used to send scripts to the display elements using the Send or << operator. For example, if out2 is a reference to an outline node, you could ask it to close itself:
Close toggles an outline node back and forth between closed and open states, just like clicking the triangle controls in the window. You can include a Boolean argument (1 or 0) for “close or leave closed” or “open or leave open.”
You can use Select, Reshow, and Deselect to blink the selection highlight on a display box. Notice that you can string together several << clauses to send an object several messages in a row. The results read left to right; for example, here Select is done first, then Reshow, then Deselect, then the other Reshow. For example:
To determine the messages that a given display box reference can understand, use Show Properties for the object. For example:
The script above creates a bivariate report and assigns it to variable, rbiv. A list of messages for the specified display box appears in the log window. An example portion of a log appears below:
For example, after running the script at the beginning of this section, you send the following lines to the rbiv report:
The background color for the graph’s frame box changes to blue. This is the same action as though you right-clicked in the graph and selected Background Color > Blue.
Many messages are the same as items in the context-menu for a given object, plus a few more. The next section, Constructing Display Trees, discusses messages for each display box type in more detail.
Note: Show Properties also works with data tables and platforms; see How Can I See All of the Messages that Can be Sent to a Data Table Object? in Data Tables, and Learning the Messages an Object Responds to in Scripting Platforms.
Using the send << operator, messages can be sent to displays as they are being constructed, not just by sending messages to already-constructed displays. This lets you disambiguate between evaluating children arguments and option arguments. It also helps make it clearer which argument is an option, and which is a script to run inside the graph.
For example, before version 5, H List Box only accepted boxes in the argument list. Now, commands can be inserted in the list of boxes using the << operator. For example, to insert a journal command in an H List Box, do the following:
As another example, the Graph Box constructor accepts the usual named arguments like this:
Alternatively, you can use the send operator to send commands to the Graph Box instead of using the named arguments.
The script above sends command1 to box, then command2 to box, then command3 to box. Note that any of the commands can change box before the next command is sent.
The script above sends command1 to box and gets the result. Command2 is sent to that result, and command3 is sent to the result of command2.
The result of command3 is assigned to the variable x. The first two commands are not assigned to x, although they might have changed box.
The Send To Report and Dispatch commands are used in tandem to customize the appearance of a report. For example, they are used to open and close outline nodes, resize graphics frames, or customize the colors in a graphics frame.
To see examples of Send To Report and Dispatch, run any analysis and change the default appearance of the report. Then, select Script > Save Script to Script Window to see the script.
Send To Report contains a list of commands to be sent to the display tree. In the example below, Send To Report contains two Dispatch commands.
Dispatch is used to send a command to a specific part of a display tree. It has four arguments. The first argument is a list of outline nodes that need to be traversed to find the desired part of the display tree. The second and third arguments work together. The second is the name of a display element, and the third is the display element’s type. These two arguments specify which particular part of the display tree is to be sent a command. The command to send is the fourth argument.
For example, open the Big Class sample data set and run the attached Bivariate script. This generates a report with a fitted line. Then, open the Lack of Fit outline node, and close the Analysis of Variance outline node. Finally, select Script > Save Script to Script Window. The following script appears. (spacing and line breaks are added here for illustration).
The Send To Report command contains two Dispatch commands. These correspond to your two customizations to the default report. Examine the first Dispatch command in detail.
The first argument says to find an outline node named “Linear Fit”. The second and third commands say to further find an Outline Box named “Lack of Fit” underneath the “Linear Fit” outline. The fourth argument is the command to send to this outline box. In this case, the message is Close(0), in other words, open the node.
The best way to deal with Send to Report and Dispatch commands is to first run a report using the mouse, creating the customizations interactively. Then, examine the script that JMP generates. Remember: the best JSL writer is JMP itself.
To find out what you can do with the platform itself, use Show Properties on the platform object:
The output in the Log window gives a few ideas for messages to send the platform. (For more on this type of scripting, see the chapter Scripting Platforms.)
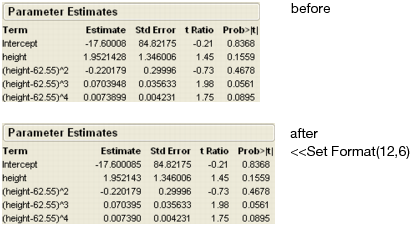
The first argument to Set Format sets the column width by the number of characters to display. The second argument sets how many decimal places are shown in the table.
How does this work? You use a For-loop to count down to the row for the term that you want. Recall that the second argument to For is a condition; as long as the condition tests true, looping continues. Here the test is “when the string in the Terms column is not "(height-62.55)^3" and we have not reached the tenth row,” so as soon as the string does match, looping stops and i’s value is the number for the matching row. You then use i as a subscript to Get on the Estimates column.
You can use the <<Set Script message to have a display box control (for example, Button Box, Combo Box, Radio Box, etc.) run a script when it is clicked with the mouse. For example:
Alternatively, you can use the <<Set Function message to have a display box control run a specific function where the first argument is the specific display box. For example:
The script above creates a Button Box with the name “press me”. When the button is clicked, the function called by Set Function changes the name to “thanks”.
Note: You cannot use both a <<Set Script and a <<Set Function at the same time. Use <<Set Function if you need to reference a specific display box object.
Window finds a window by its "title" and returns a reference to that window. For example, to close a window titled "Analysis Results" submit the following code:
|
•
|
Window() with no arguments returns a list of all windows open in JMP.
|
|
•
|
Window(n) returns the nth window.
|
|
•
|
Window("title") returns the window with the specified title.
|
Note: If the nth window or a window with the specified title does not exist, an empty list is returned instead.
