Control Limits for X- and R-charts


Center line for R-chart: By default, the center line for the ith subgroup (where k is the sigma multiplier) indicates an estimate of the expected value of Ri. This value is computed as:  , where
  is an estimate of σ. If you specify a known value (σ0) for σ, the central line indicates the value of
  . Note that the central line varies with ni.
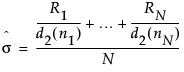
σ = process standard deviation
d2(n) is the expected value of the range of n independent normally distributed variables with unit standard deviation
d3(n) is the standard error of the range of n independent observations from a normal population with unit standard deviation
N is the number of subgroups for which
Control Limits for X- and S-charts


Center line for S-chart: By default, the center line for the ith subgroup (where k is equal to the sigma multiplier) indicates an estimate of the expected value of si. This value is computed as  , where
  is an estimate of σ. If you specify a known value (σ0) for σ, the central line indicates the value of
  . Note that the central line varies with ni.
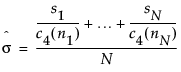
σ = process standard deviation
c4(n) is the expected value of the standard deviation of n independent normally distributed variables with unit standard deviation
c5(n) is the standard error of the standard deviation of n independent observations from a normal population with unit standard deviation
N is the number of subgroups for which

X = the mean of the individual measurements
σ = the process standard deviation
k = the number of standard deviations
d2(n) = expected value of the range of n independent normally distributed variables with unit standard deviation.
d3(n) = standard error of the range of n independent observations from a normal population with unit standard deviation.
p is the average proportion of nonconforming items taken across subgroups
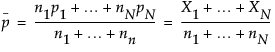
k is the number of standard deviations
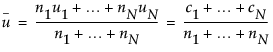
u is the expected number of nonconformities per unit produced by process
u is the average number of nonconformities per unit taken across subgroups. The quantity u is computed as a weighted average

N is the number of subgroups
u is the expected number of nonconformities per unit produced by process
u is the average number of nonconformities per unit taken across subgroups. The quantity u is computed as a weighted average
N is the number of subgroups
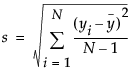
Levey-Jennings charts show a process mean with control limits based on a long-term sigma. The control limits are placed at 3s distance from the center line.
The standard deviation, s, for the Levey-Jennings chart is calculated the same way standard deviation is in the Distribution platform.
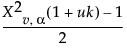
Based on this approximation, approximate upper and lower control limits can be determined. For a nominal level αType 1 error probability in one direction, an approximate upper control limit is a limit UCL such that:
Likewise, an approximate lower control limit is a limit LCL for a nominal level αType 1 error probability is a limit such that:
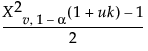
|
•
|