Bladder Cancer Recurrences Example
The sample data file Bladder Cancer.jmp contains data on cancerous bladder tumor recurrences from the Veteran’s Administration Co-operative Urological Research Group. See Andrews and Herzberg (1985, table 45). All patients presented with superficial bladder tumors, which were removed upon entering the trial. Each patient was then assigned to one of three treatment groups: placebo pills, pyridoxine (vitamin B6) pills, or periodic chemotherapy with Thiotepa. The following analysis of tumor recurrence explores the progression of the disease, and whether there is a difference among the three treatments.
Launch the platform with the options shown in Figure 6.8.
Figure 6.8 Bladder Cancer Launch Dialog
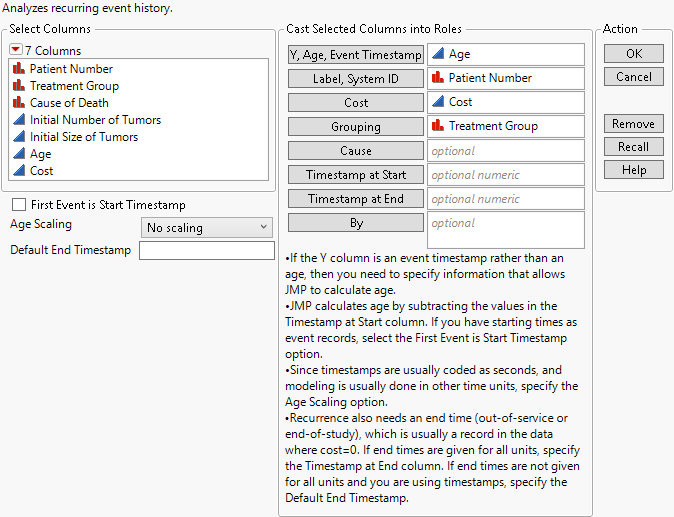
Figure 6.9 shows the MCF plots for the three treatments.
Figure 6.9 Bladder Cancer MCF Plot
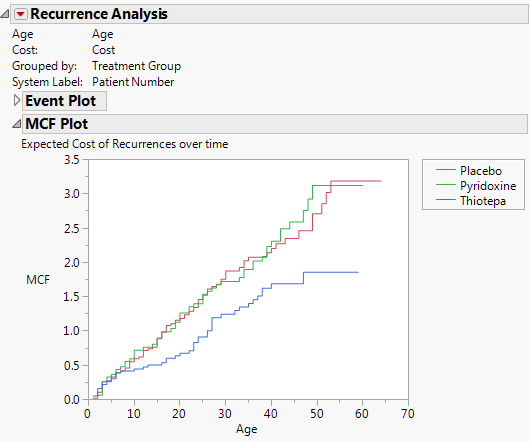
Note that all three of the MCF curves are essentially straight lines. The slopes (rates of recurrence) are therefore constant over time, implying that patients do not seem to get better or worse as the disease progresses.
To examine if there are differences among the treatments, click the Recurrence Analysis red triangle and select Plot MCF Differences.
Figure 6.10 MCF Differences
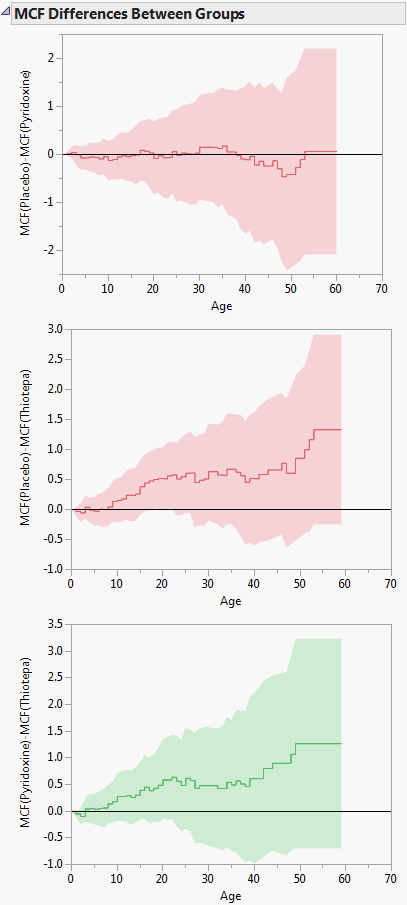
To determine whether there is a statistically significant difference between treatments, examine the confidence limits on the differences plot. If the limits do not include zero, the treatments are convincingly different. The graphs in Figure 6.10 show there is no significant difference among the treatments.